Page 80 - 《水产学报》2025年第8期
P. 80

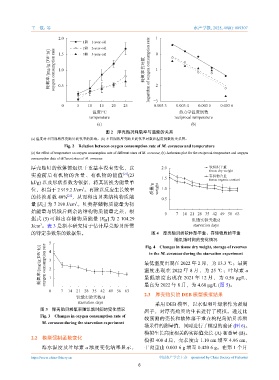
王一航,等                                                                 水产学报, 2025, 49(8): 089307


                          2.0                                       1
                                    1龄 1-year-old
                                    2龄 2-year-old                   0
                      耗氧率/[mg/(g DW·h)]  oxygen consumption rate  1.0  耗氧率的对数 logarithm of oxygen consumption rate  −1
                                    3龄 3-year-old
                          1.5


                                                                  −2
                          0.5


                                                                   0.003 3
                           0      5    10   15   20   25          −3        0.003 4   0.003 5  0.003 6
                                        温度/°C                                热力学温度倒数
                                       temperature                          reciprocal temperature
                                          (a)                                      (b)
                                              图 2    厚壳贻贝耗氧率与温度的关系
              (a) 温度对不同规格厚壳贻贝耗氧率的影响,(b) 不同规格厚壳贻贝耗氧率对数和温度倒数的关系图。
                            Fig. 2 Relation between oxygen consumption rate of M. coruscus and temperature
              (a) the effect of temperature on oxygen consumption rate of different sizes of M. coruscus; (b) Arrhenius plot for the reciprocal temperature and oxygen
              consumption data of different sizes of M. coruscus.

              厚壳贻贝的软体部组织干重基本没有变化,以                                    2.0                 软组织干重
                                                                                          tissue dry weight
              实验前后有机物的含量、有机物的能值                       [21] (23                            有机物含量
                                                                      1.5                 tissue organic content
              kJ/g) 以及形状系数为依据,将其转换为能量单
              位,相当于       2 919.2 J/cm 。再除以反应生长效率                 质量/g  weight  1.0
                                    3
                              [21]
              的转换系数       40% ,从而得出贝类结构物质能                            0.5
              量  [E ] 为  7 298 J/cm 。贝类存储物质能量为初
                                 3
                   G
              始能量与饥饿后剩余的结构物质能量之差,根
                                                                       0    7  14 21 28 35 42 49 56 63
              据式   (5) 可得出存储物质能量            [E ] 为  2 104.29
                                              M                                    饥饿实验天数/d
              J/cm 。表   3  是指本研究用于估计厚壳贻贝所需                                          starvation days
                  3
              的特定参数集的数据集。                                         图 4    厚壳贻贝的软体部干重、存储物质的干重
                                                                           随饥饿时间的变化情况
                      5 4                                      Fig. 4 Changes in tissue dry weight, storage of reserves
                  耗氧率/[mg/(g DW·h)] oxygen consumption rate  3 2 1  最低温度出现在 2022  2022  8  年  月,为 月,为 25 ℃;叶绿素  a
                                                                 in the M. coruscus during the starvation experiment
                                                                                              13.3 ℃;最高
                                                                                     2
                                                               温度出现在
                                                                               年
                                                                                          月,为
                                                               最低浓度出现在
                                                                                    年
                                                                                                 0.56 μg/L,
                                                                                2021
                                                                                       12

                      0    7  14 21 28 35 42 49 56 63          最高为    2022 年  8  月,为  4.68 μg/L (图  5)。
                                                               2.3    厚壳贻贝的    DEB  模型模拟结果
                                  饥饿实验天数/d
                                  starvation days                  采用   DEB  模型,以水温和叶绿素作为强制
                  图 3    厚壳贻贝耗氧率随饥饿时间的变化情况                     因子,对厚壳贻贝的生长进行了模拟。通过比
                  Fig. 3 Changes in oxygen consumption rate of
                                                               较预测的壳长和软体部干重在枸杞岛贻贝养殖
                   M. coruscus during the starvation experiment  场采样的测量值,同时进行了模型的验证                  (图  6)。

                                                               模拟生长高度相关的实际值壳长                (A) 和重量   (B)。
              2.2    模型强制函数变化
                                                               模拟   400 d  后,壳长度由      1.10 cm 增至  4.96 cm,
                   海水温度及叶绿素           a  浓度变化结果显示,             干肉重由     0.003 6 g  增至  0.420 6 g。在第  1  个月

              https://www.china-fishery.cn                           中国水产学会主办    sponsored by China Society of Fisheries
                                                            6
   75   76   77   78   79   80   81   82   83   84   85