Page 71 - 《水产学报》2025年第7期
P. 71

张子焜,等                                                                 水产学报, 2025, 49(7): 079106


                                             黑色区域 black area        100           黑色区域 black area
                                             白色区域 white area
                                                                                  白色区域 white area
                               100
                          累积持续时间占比/%  cumulative duration  time ratio  80  B  b  B  b  C  A  c  B  b  B  b  累积持续时间占比/%  cumulative duration  time ratio 80  B  a  B  a  AB ab  AB ab  AB ab  A  b
                                             a
                               60
                                                                     60
                               40
                                                                     40
                               20
                                0                                    20
                                                                      0
                                    1   2   3    4   5   6               1   2    3   4   5    6
                                         菲浓度/(μg/L)                            菲浓度/(μg/L)
                                        Phe concentration                    Phe concentration
                                              (a)                                  (b)
                                             黑色区域 black area        100           黑色区域 black area
                               100
                          累积持续时间占比/%  cumulative duration  time ratio  60  B  a  B  a  B a  A  b  A  b  B  a  累积持续时间占比/%  cumulative duration  time ratio 80  B  a  B  a  A b  A  b  A  b  A  b
                                                                                  白色区域 white area
                                             白色区域 white area
                               80
                                                                     60
                                                                     40
                               40
                               20
                                                                      0
                                0                                    20
                                    1   2   3    4   5   6               1   2    3   4   5    6
                                         菲浓度/(μg/L)                            菲浓度/(μg/L)
                                        Phe concentration                    Phe concentration
                                              (c)                                  (d)

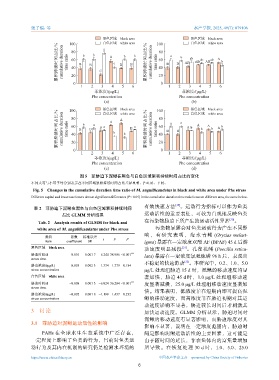
                                   图 5    菲胁迫下泥鳅在黑色与白色区域累积持续时间占比的变化
              不同大写与小写字母分别表示在不同区域累积持续时间占比差异显著,P<0.05,下同。
               Fig. 5 Changes in the cumulative duration time ratio of M. anguillicaudatus in black and white area under Phe stress
              Different capital and lowercase letters denote significant differences (P< 0.05) in the cumulative duration time ratio between different area, the same below.
                                                                            [19]
                                                               有效快速方法 。运动行为指标可以作为鱼类
               表 2    菲胁迫下泥鳅在黑色与白色区域累积持续时间
                           占比   GLMM  分析结果                     运动活性的重要表征,可较为直观地反映鱼类
                                                               在污染物胁迫下所产生的运动活性异常 。
                                                                                                   [20]
                 Tab. 2    Analysis results of GLMM for black and
                                                                   污染物暴露会对鱼类运动行为产生不同影
                 white area of M. anguillicaudatus under Phe stress
                                                               响 , 有 研 究 表 明 , 海 水 青 鳉      (Oryzias melast-
                    类目         系数   标准误差
                                             t   F     P
                    item     coefficient  SE                   igma) 暴露在一定浓度双酚          AF (BPAF) 45 d  后游
              黑色区域 black area                                  动速度明显减慢         [21] 。孔雀花鳉    (Poecilia reticu-
              胁迫时间/d           0.010  0.001 7  6.244 38.986 <0.001 ***  lata) 暴露在一定浓度氯吡硫磷   96 h  后,表现出
              stress time
                                                                                [22]
                                                               不稳定的快速游动 。本研究中,0.2、1.0、5.0
              胁迫浓度/(μg/L)      0.003  0.002 3  1.334 1.779 0.184
              stress concentration                             μg/L  处理组胁迫     15 d  时,泥鳅的移动速度均显
              白色区域 white area                                  著加快,胁迫        45 d  时,1.0 μg/L  处理组移动速
              胁迫时间/d           −0.008  0.001 3 −6.024 36.284 <0.001 ***  度显著减慢,25.0 μg/L  处理组移动速度显著加
              stress time
                                                               快。结果表明,低浓度菲在短期内即可提高泥
              胁迫浓度/(μg/L)      −0.002  0.001 8 −1.199 1.437 0.232
              stress concentration                             鳅的移动速度,而高浓度菲在胁迫初期对其运
                                                               动速度影响不显著,胁迫较长时间后才刺激其
              3    讨论                                          加快运动速度。GLMM           分析显示,胁迫时间对
                                                               泥鳅的移动速度有显著影响,而胁迫浓度对其

              3.1    菲胁迫对泥鳅运动活性的影响
                                                               影响不显著,说明在一定浓度范围内,胁迫时
                   PAHs 在全球水生生态系统中广泛存在,                        间是影响泥鳅运动活性的主要因素,这可能是
              一定程度上影响了鱼类的行为,目前对鱼类运                             由于随时间的延长,菲在鱼体内的富集量增加
              动行为及其内在机制的研究仍是检测水环境的                             所导致。在恢复处理            30 d  时,1.0、5.0、25.0

              https://www.china-fishery.cn                           中国水产学会主办    sponsored by China Society of Fisheries
                                                            6
   66   67   68   69   70   71   72   73   74   75   76