
Page 106 - 《摩擦学学报》2020年第5期
P. 106
第 5 期 许蓓蓓, 等: 氮化钒(VN)涂层在不同载荷下的摩擦磨损行为 661
0.44 −0.52
Friction coefficient log(μ-a)
0.42 Linear fit of data Linear fit of data
−0.56
0.40 −0.60
Friction coefficient 0.36 15 N Equation y=a+b·x 10 N Friction coefficient −0.64 10 N Adj.R-square 0.614 15 N
0.38
0.34
Equation y=a+b·x
−0.68
Adj.R-square 0.590 97
0.32
Value
Value
Item
Item
0.30
20 N
0.200 68
0.114 7
Intercept 0.124 35 Standard error −0.72 Intercept −0.241 94 Standard error 20 N
0.28 −0.76
Slpoe 0.160 65 0.081 46 Slpoe −0.352 06 0.172 17
0.26
−0.80
1.25 1.30 1.35 1.40 1.45 1.50 1.55 1.60 1.00 1.05 1.10 1.15 1.20 1.25 1.30 1.35
Inverse hertzian pressure/(1/GPa) log(F n )
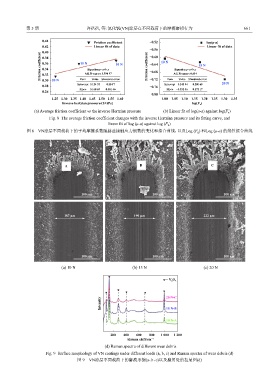
(a) Average friction coefficient vs the inverse Hertzian pressure (b) Linear fit of log(μ-a) against log(F n )
Fig. 8 The average friction coefficient changes with the inverse Hertzian pressure and its fitting curve, and
linear fit of log (μ-a) against log (F n )
图 8 VN涂层不同载荷下的平均摩擦系数随赫兹接触应力倒数的变化和拟合曲线,以及Log (F n ) 和Log (μ-a) 的线性拟合曲线
A B C
100 μm 100 μm 100 μm
187 μm 190 μm 222 μm
100 μm 100 μm 100 μm
(a) 10 N (b) 15 N (c) 20 N
— V 2 O 5
Intensity 20 N-C
15 N-B
10 N-A
200 400 600 800 1 000 1 200
Raman shift/cm −1
(d) Raman spectra of different wear debris
Fig. 9 Surface morphology of VN coatings under different loads (a, b, c) and Raman spectra of wear debris (d)
图 9 VN涂层不同载荷下的磨痕形貌(a、b、c)以及磨屑处的拉曼图(d)