
Page 252 - 《高原气象》2026年第2期
P. 252
高 原 气 象 45 卷
552
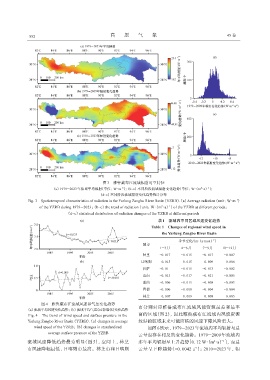
图3 雅鲁藏布江流域辐射时空特征
-2
(a) 1979 -2023年流域平均辐射(单位: W·m ); (b~c) 不同阶段流域辐射变化趋势[单位: W·(m·a) ];
-1
2
(d~e) 不同阶段流域辐射变化趋势统计分布
-2
Fig. 3 Spatiotemporal characteristics of radiation in the Yarlung Zangbo River Basin (YZRB).(a) Average radiation (unit: W·m )
2
-1
of the YZRB during 1979 -2023; (b~c) the trend of radiation [unit: W·(m·a)] of the YZRB at different periods;
(d~e) statistical distribution of radiation changes of the YZRB at different periods
表1 流域内不同区域风速变化趋势
Table 1 Changes of regional wind speed in
the Yarlung Zangbo River Basin
-1
季节变化/[m·(s·mon)]
城市
1 -3月 4 -6月 7 -9月 10 -12月
阿里 -0. 017 -0. 015 -0. 017 -0. 007
日喀则 -0. 015 -0. 015 -0. 009 -0. 006
拉萨 -0. 01 -0. 015 -0. 013 -0. 002
山南 -0. 013 -0. 017 -0. 011 -0. 005
那曲 -0. 006 -0. 015 -0. 008 -0. 003
昌都 -0. 006 -0. 008 -0. 004 -0. 004
林芝 -0. 007 -0. 009 -0. 008 -0. 005
图4 雅鲁藏布江流域风速和气压变化趋势
市分别对应雅鲁藏布江流域风能资源最差和最丰
(a) 流域平均风速变化趋势; (b) 流域平均气压(已标准化)变化趋势
Fig. 4 The trend of wind speed and surface pressure in the 富的区域(图 2), 因此雅鲁藏布江流域内风能资源
Yarlung Zangbo River Basin (YZRB).(a) changes in average 较好的区域未来可能面临的风速下降风险更大。
wind speed of the YZRB; (b) changes in standardized 如图6所示, 1979 -2023年流域内平均辐射与总
average surface pressure of the YZRB
云量也存在相反的变化趋势。1979 -2009年流域内
2
-1
流域风速降低趋势最为明显(图 5), 空间上, 林芝 多年平均辐射呈上升趋势[0. 12 W·(m·a)], 而总
-1
市风速降幅最低、 日喀则市最高。林芝市和日喀则 云量呈下降趋势(-0. 0042 a ); 2010 -2023 年, 辐