
Page 104 - 《高原气象》2026年第1期
P. 104
高 原 气 象 45 卷
100
-1
6
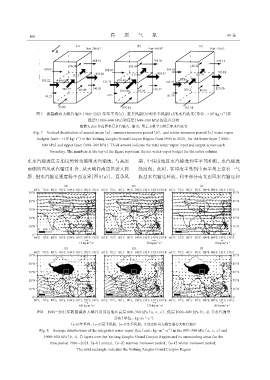
图7 雅鲁藏布大峡谷地区1986 -2021年年平均(a)、 夏季风期(b)和冬季风期(c)的水汽收支(单位: ×10 kg·s )在
低层(1000~600 hPa)和高层(600~300 hPa)的垂直分布
粗箭头表示各边界整层水汽输入、 输出; 图上方数字为整层净水汽收支
Fig. 7 Vertical distribution of annual mean (a), summer monsoon period (b), and winter monsoon period (c) water vapor
6
-1
budgets (unit: ×10 kg·s ) in the Yarlung Zangbo Grand Canyon Region from 1986 to 2021, for the lower layer (1000~
600 hPa) and upper layer (600~300 hPa). Thick arrows indicate the total water vapor input and output across each
boundary. The numbers at the top of the figure represent the net water vapor budget for the entire column
东水汽输送在孟加拉湾转为偏南水汽输送, 与高原 期, 中纬度地区水汽输送和年平均相似, 水汽输送
南侧的西风水汽输送汇合, 从大峡谷南边界进入高 强度强。此时, 在印度半岛到中南半岛上空有一气
原, 但水汽输送强度弱于西边界[图 8(a)]。夏季风 旋型水汽输送环流, 利于部分南支西风水汽输送和
图8 1986 -2021年雅鲁藏布大峡谷及周边地区高层600~300 hPa (a, c, e), 低层1000~600 hPa (b, d, f)水汽通量
−1
−1
分布(单位: kg·m ·s )
(a~b)年平均, (c~d)夏季风期, (e~f)冬季风期; 实线方框内为雅鲁藏布大峡谷地区
−1
Fig. 8 Average distributions of the integrated water vapor flux (unit: kg·m ·s ) in the 600~300 hPa (a, c, e) and
−1
1000~600 hPa (b, d, f) layers over the Yarlung Zangbo Grand Canyon Region and its surrounding areas for the
time period 1986 -2021.(a~b) annual, (c~d) summer monsoon period, (e~f) winter monsoon period.
The solid rectangle indicates the Yarlung Zangbo Grand Canyon Region