
Page 47 - 《高原气象》2025年第6期
P. 47
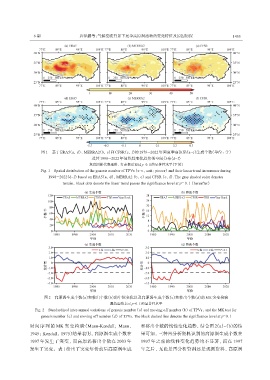
6 期                  唐泽鹏等:气候变暖背景下夏季高原涡活动的变化特征及原因初探                                         1455


                    图1 基于ERA5(a, d)、 MERRA2(b, e)和CFSR(c, f)的1979 -2022年间夏季高原涡(a~c)生成个数(单位: 个)
                                           及其1998 -2022年间线性变化趋势的空间分布(d~f)
                                          灰色阴影代表地形, 打点表示通过p=0. 1的显著性水平(下同)
                    Fig. 1 Spatial distribution of the genesis number of TPVs (a~c, unit: pieces) and their linear trend in summer during
                       1998 -2022(d~f) based on ERA5(a, d), MERRA2 (b, e) and CFSR (c, f). The gray shaded color denotes
                             terrain, black dots denote the linear trend passes the significance level at p= 0. 1 (hereafter)


                     图2 高原涡生成个数(a)和移出个数(b)的年际变化以及高原涡生成个数(c)和移出个数(d)的MK突变检验
                                                   黑色虚线表示p=0. 1的显著性水平
                 Fig. 2 Standardized inter-annual variations of genesis number (a) and moving off number (b) of TPVs, and the MK test for
                    genesis number (c) and moving off number (d) of TPVs. The black dashed line denotes the significance level at p=0. 1
               时间序列的 MK 突变检验(Mann-Kendall; Mann,                 和移出个数的线性变化趋势, 结合图 2(a)~(b)的结

               1945; Kendall, 1975)结果表明, 高原涡生成个数在                果可知, 三种再分析资料识别的高原涡生成个数在
               1997 年发生了突变, 而高原涡移出个数在 2003 年                     1997 年之前的线性变化趋势均不显著, 而在 1997
               发生了突变。表 1给出了突变年份前后高原涡生成                           年之后, 无论是再分析资料还是观测资料, 高原涡