
Page 189 - 《高原气象》2022年第6期
P. 189
高 原 气 象 41 卷
1552
气候,黑河干流山区在 SSP1-2. 6 情景下年降水量 期中,年降水量在情景中的分布表现为随辐射强迫
增加约 46. 80 mm(16~60. 80 mm),年平均气温增 增加而逐渐分散,即在辐射强迫小的情景下年降水
加约 1. 24 ℃(0. 80~2. 16 ℃);在 SSP5-8. 5 情景下 量集中在该时期的平均降水量附近,在辐射强迫大
年降水量增加约 103. 08 mm(48. 08~164. 48 mm), 的情景下年降水量分布较离散,离散程度随时间变
年平均气温增加约6. 08 ℃(5. 68~6. 48 ℃)。 化逐渐增加。同一时期中,站点出现异常频次存在
4. 2. 3 未来不同时期降水/气温分析 空间差异性,张掖的年降水量在各时期内分布最均
为了更进一步探讨未来不同时期的气候变化, 匀,极少出现异常降水;其次是祁连,年降水量在
将 2021-2040 年、2041-2060 年、2081-2100 年依 各时期内分布较集中,在近期和中期存在少数异常
次作为 21 世纪的近期、中期、远期展开气候变化 降水;然后是野牛沟,年降水量在各时期内分布较
分析。 离散,在近期和远期有异常降水;最后是托勒,年
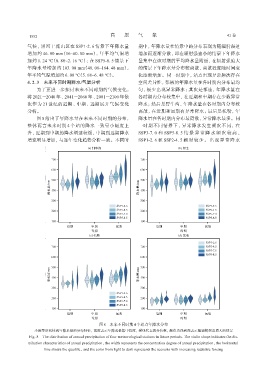
图 8 给出了年降水量在未来不同时期的分布, 降水量在各时期内分布最离散,异常降水最多。同
整体而言未来时期 4 个站的降水一致呈小幅度上 一时期不同情景下,异常降水发生频次不同,在
升,近期到中期的降水增速较缓,中期到远期降水 SSP3-7. 0 和 SSP5-8. 5 情 景 异 常 降 水 频 次 较 高 ,
增速明显增加,与逐年变化趋势分析一致。不同时 SSP1-2. 6 和 SSP2-4. 5 相对较少。出现异常降水
图8 未来不同时期4个站点年降水分布
小提琴形状体现年降水量的分布特征,宽度表示年降水量集中程度,横线代表四分位数,颜色由浅到深表示随辐射强迫增大的情景
Fig. 8 The distribution of annual precipitation of four meteorological stations in future periods. The violin shape indicates the dis‐
tribution characteristics of annual precipitation,the width represents the concentration degree of annual precipitation,the horizontal
line shows the quartile,and the color from light to dark represents the scenario with increasing radiative forcing