
Page 90 - 《高原气象》2022年第5期
P. 90
5 期 王 钦等:四川盆地两类区域持续性暴雨的环流物理量场特征及成因分析 1183
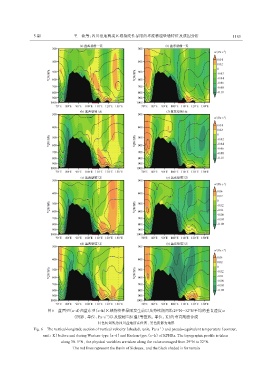
图6 盆西型(a~d)和盆东型(e~h)区域持续性暴雨发生前以及持续期间沿29°N-32°N平均的垂直速度ω
-1
(阴影,单位:Pa·s )以及假相当位温(等值线,单位:K)的垂直剖面合成
红色短划线为四川盆地所在位置,黑色阴影为地形
Fig. 6 The vertical-longitude section of vertical velocity(shaded,unit:Pa·s )and pseudo-equivalent temperature(contour,
-1
unit:K)before and during Western-type(a~d)and Eastern-type(e~h)of RPHRs. The topographic profile is taken
along 30. 5°N,the physical variables are taken along the value averaged from 29°N to 32°N.
The red lines represent the Basin of Sichuan,and the black shaded is for terrain