
Page 265 - 《高原气象》2022年第5期
P. 265
高 原 气 象 41 卷
1358
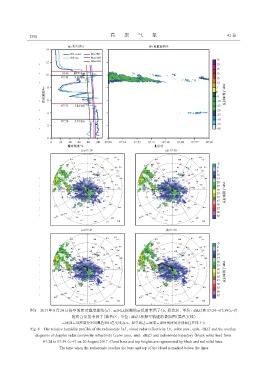
图8 2017年8月20日探空的相对湿度廓线(a),云雷达探测的云反射率因子(b,彩色区,单位:dBZ)和07:24-07:59(c~f)
的组合反射率因子(彩色区,单位:dBZ)和探空轨迹的叠加图(黑色实线)
云底和云顶高度分别用黑色和红色实线表示,探空到达云底或云顶时的时间分别标注在线下方
Fig. 8 The relative humidity profiles of the radiosonde(a),cloud radar reflectivity(b,color area,unit:dBZ)and the overlay
diagrams of doppler radar composite reflectivity(color area,unit:dBZ)and radiosonde trajectory(black solid line)from
07:24 to 07:59(c~f)on 20 August 2017. Cloud base and top heights are represented by black and red solid lines.
The time when the radiosonde reaches the base and top of the cloud is marked below the lines