
Page 217 - 《高原气象》2022年第5期
P. 217
高 原 气 象 41 卷
1310
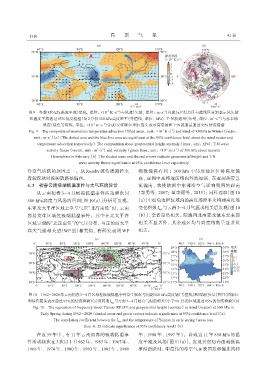
图9 冬季850 hPa温度平流(填色,单位:×10 K·s )与风速(矢量,单位:m·s )合成(a)(打点区与蓝线区分别表示风矢量
-7
-1
-1
2
-2
和温度平流通过95%信度检验)及2月份300 hPa高度距平(等值线,单位:hPa)、T-N波通量(矢量,单位:m·s )与东半球
-1
-5
涡度(绿色等值线,单位:×10 m·s )合成(b)阴影区和红箭头表示高度场和T-N波通量通过95%信度检验
-1
Fig. 9 The composite of anomalous temperature advection(filled areas,unit:×10 K·s )and wind of 850hPa in Winter(vector,
-7
unit:m·s )(a)(The dotted area and the blue line area are significant at the 95% confidence level about the wind vector and
-1
temperature advection respectively). The composition about geopotential height anomaly(linea,unit:hPa)、T-N wave
-2
-1
2
-5
activity fluxes(vector,unit:m·s )and vorticity(green linea,unit:×10 m·s )of 300 hPa about Eastern
Hemisphere in February(b). The shaded areas and the red arrows indicate geopotential height and T-N
wave activity fluxes significance at 95% confidence level espectively
冷空气活跃的原因之一。从 Rossby 波传播路径来 指数偏高有利于 500 hPa 中纬度地区位势高度偏
看较深秋时段频散路径偏西。 高,亚洲中高纬地区纬向环流加强、东亚副热带急
4. 3 初春云南极端低温事件与大气环流异常 流偏南,致使欧洲中东部冷空气影响我国的西南
从云南初春 3-4 月极端低温事件活动频次同 (李勇等,2007;董李丽等,2015);同样选取[图 10
500 hPa 高度与风场的回归[图 10(a)]分析可发现, (a)]中红色边框区域内的高度场距平来构建高度场
东亚及太平洋区域上空呈气压“北高南低”时,云南 变化指数 I 与云南 3-4月气温求相关后发现[图 10
hgt
容易发生区域性极端低温事件。其中在北太平洋 (b)],全省呈负相关,除滇西北南部及滇东北东部
区域呈现的“北正南负”的气压分布,与正的西太平 相关不显著外,其余地区均与高度指数呈显著负
洋大气遥相关型(WP 型)相类似,有研究表明 WP 相关。
图10 1962-2020年云南初春3-4月区域性极端低温事件发生频次与同期500 hPa高度场(等值线)和风场(矢量)回归(阴影区
和绿色箭头表示通过95%的信度检验)(a)及同期I 与云南3-4月站点气温的相关(小于-0. 25的区域通过95%的信度检验)(b)
hgt
Fig. 10 The regression of frequency about Yunnan RELTE and geopotential height(contour)or wind(vector)at 500 hPa in
Early Spring during 1962-2020(shaded areas and green vectors indicate significance at 95% confidence level)(a).
The correlation coefficient between the I and the temperature of Yunnan in early spring(areas less
hgt
than -0. 25 indicate significance at 95% confidence level)(b)
在近 59 年中,有 11 年云南初春的极端低温事 年、1990 年、1997 年)。合成这 11 年 850 hPa 的温
件活动频次在 3 次以上(1962 年、1965 年、1967 年、 度平流及风场[图 11(a)],发现云南初春极端低温
1968 年、1974 年、1980 年、1993 年、1985 年、1989 事件活跃时,中高纬的冷空气在我国东部偏北风和