
Page 76 - 《高原气象》2022年第1期
P. 76
高 原 气 象 41 卷
74
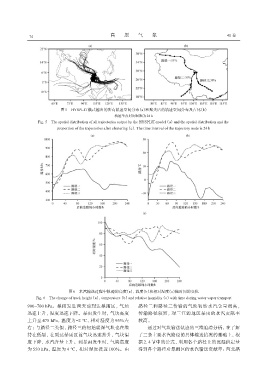
图5 HYSPLIT模式输出的所有轨迹空间分布(a)和聚类后的轨迹空间分布及占比(b)
轨迹节点时间间隔为24 h
Fig. 5 The spatial distribution of all trajectories output by the HYSPLIT-model(a)and the spatial distribution and the
proportion of the trajectories after clustering(c). The time interval of the trajectory node is 24 h
图6 水汽输送过程中轨迹的高度(a)、温度(b)和相对湿度(c)随时间的变化
Fig. 6 The change of track height(a),temperature(b)and relative humidity(c)with time during water vapor transport
900~700 hPa。暴雨发生两天前到达暴雨区,气块 路径二和路径三传输的气块初始水汽含量很高,
迅速上升,温度迅速下降。暴雨发生时,气块高度 传输路径较短,对三江源地区暴雨的水汽贡献率
上升至 475 hPa,温度为-2 ℃,相对湿度为 95% 左 较高。
右;与路径二类似,路径三的初始暖湿气块也在维 通过对气块输送轨迹的三维追踪分析,在了解
持在低层,在到达暴雨区前气块迅速抬升,气块温 了三条主要水汽路径的具体输送情况的基础上,根
度下降,水汽含量上升。到暴雨发生时,气块高度 据 2. 4 节中的公式,利用各个路径上的比湿值定量
为 550 hPa,温度为 4 ℃,相对湿度接近 100%。由 得到各个路径对暴雨区的水汽输送贡献率:西北路