
Page 188 - 《高原气象》2022年第1期
P. 188
高 原 气 象 41 卷
186
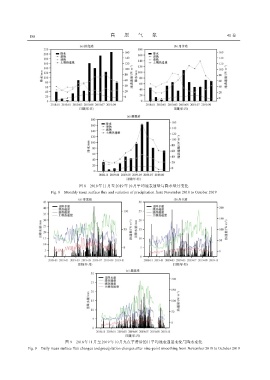
图 8 2018年11月至2019年10月平均地表通量与降水量月变化
Fig. 8 Monthly mean surface flux and variation of precipitation from November 2018 to October 2019
图 9 2018年11月至2019年10月九点平滑后的日平均地表通量变化与降水变化
Fig. 9 Daily mean surface flux changes and precipitation changes after nine-point smoothing from November 2018 to October 2019