
Page 173 - 《高原气象》2022年第1期
P. 173
1 期 陈亚玲等:江河源区水汽输送与收支的时空演变特征分析 171
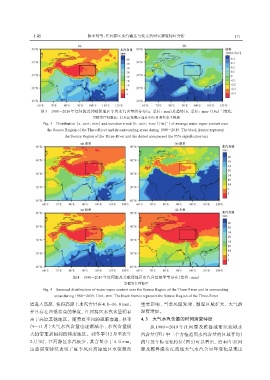
图3 1980-2019年江河源及其毗邻地区平均水汽含量的分布(a,单位:mm)及趋势[b,单位:mm·(10a)]变化
-1
黑框为江河源区;打点区域表示通过95%显著性水平检验
-1
Fig. 3 Distribution(a,unit:mm)and variation trend[b,unit:mm·(10a)]of average water vapor content over
the Source Region of the Three-River and its surrounding areas during 1980-2019. The black frames represent
the Source Region of the Three-River and the dotted area passed the 95% significance test
图4 1980-2019年江河源及其毗邻地区水汽含量的季节分布(单位:mm)
黑框为江河源区
Fig. 4 Seasonal distributions of water vapor content over the Source Region of the Three-River and its surrounding
areas during 1980-2019. Unit:mm. The black frames represent the Source Region of the Three-River
道进入高原,使得高原上水汽含量在4. 0~16. 0 mm, 重要影响,当季风爆发时,潮湿区域扩大,大气的
并且存在西低东高的梯度,江河源区水汽含量明显 湿度增加。
高于高原其他地区。随着夏季风的逐渐衰退,秋季 4. 3 大气水汽含量的时间演变特征
(9-11 月)大气水汽含量也逐渐减小,水汽含量极 从 1980-2019 年江河源及雅鲁藏布江流域水
大值带重新回到低纬度地区。到冬季(12 月至次年 汽含量(图 1中三个方框范围水汽含量的区域平均)
2 月)时,江河源区水汽极少,其含量小于 4. 0 mm。 的年及年际变化特征(图 5)可以看出,近 40 年江河
这些演变特征表明了夏季风对高原地区水资源的 源及雅鲁藏布江流域大气水汽含量年变化呈现出