
Page 27 - 《高原气象》2021年第5期
P. 27
高 原 气 象 40 卷
988
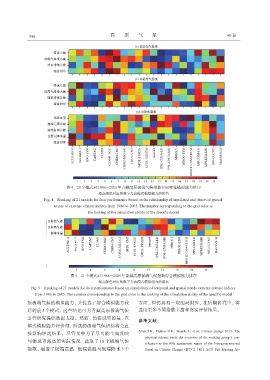
图4 21个模式对1986-2005年青藏高原极端气候指数空间变化模拟能力排序
格点颜色对应的数字为该模式模拟能力的排名
Fig. 4 Ranking of 21 models for their performance based on the relationship of simulated and observed spatial
trends of extreme climate indices from 1986 to 2005. The number corresponding to the grid color is
the ranking of the simulation ability of the specific model
图5 21个模式对1986-2005年青藏高原极端气候指数综合模拟能力排序
格点颜色对应的数字为该模式模拟能力的排名
Fig. 5 Ranking of 21 models for their performance based on simulations of temporal and spatial trends extreme climate indices
from 1986 to 2005. The number corresponding to the grid color is the ranking of the simulation ability of the specific model
原极端气候的模拟能力,并优选了综合模拟能力较 方面,但仍具有一定的局限性,在后期研究中,将
好的前 5 个模式,这些结论可为青藏高原极端气候 选用更多不同指数丰富和充实评估结果。
事件研究提供数据支撑。然而,值得说明的是,在
参考文献:
模式模拟能力评价时,所选的极端气候指标将会直
Allen S K,Plattner G K,Nauels A,et al,Climate change 2013:The
接影响评选结果。尽管文中为了尽可能全面反映
physical science basis. An overview of the working group 1 con‐
与体现青藏高原实际情况,选取了 10 个极端气候
tribution to the fifth assessment report of the Intergovernmental
指数,涵盖了极端高温、极端低温与极端降水 3 个 Panel on Climate Change(IPCC)[M]. AGU Fall Meeting Ab‐