Page 225 - 《高原气象》2021年第5期
P. 225

高     原      气     象                                 40 卷
              1186


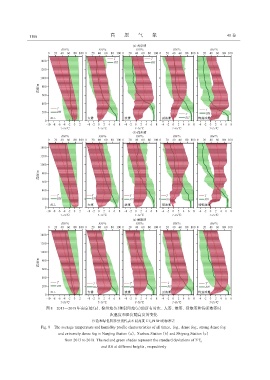
                      图8   2013—2018年南京站(a)、徐州站(b)和射阳站(c)的所有时次、大雾、浓雾、强浓雾和特强浓雾时
                                                   次温度和湿度随高度的变化
                                           红色和绿色阴影分别代表不同高度T-T 和RH的标准差
                                                                     S
                    Fig. 8  The average temperature and humidity profile characteristics of all times,fog,dense fog,strong dense fog
                           and extremely dense fog in Nanjing Station(a),Xuzhou Station(b)and Shiyang Station(c)
                              from 2013 to 2018. The red and green shades represent the standard deviations of T-T S
                                               and RH at different heights,respectively
   220   221   222   223   224   225   226   227   228   229   230