
Page 10 - 《高原气象》2021年第5期
P. 10
5 期 王梦晓等:青藏高原鄂陵湖结冰期升温特征研究 971
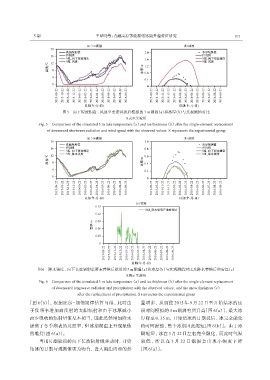
图5 向下短波辐射、风速单要素替换后模拟的3 m湖温(a)和冰厚(b)与其观测值对比
S表示实验组
Fig. 5 Comparison of the simulated 3 m lake temperature(a)and ice thickness(b)after the single-element replacement
of downward shortwave radiation and wind speed with the observed values. S represents the experimental group
图6 降水强度、向下长波辐射单要素替换后模拟的3 m湖温(a)和冰厚(b)与其观测值对比及降水替换后的雪厚(c)
S表示实验组
Fig. 6 Comparison of the simulated 3 m lake temperature(a)and ice thickness(b)after the single-element replacement
of downward longtwave radiation and precipitation with the observed values,and the snow thickness(c)
after the replacement of precipitation. S represents the experimental group
[图 6(b)],根据比尔-朗伯定律估算可得,此时由 量增多,从而使 2015 年 9 月 22 日至开始结冰的这
于反照率增加而反射的太阳辐射和由于冰厚减小 段时间模拟的 3 m 湖温有所升高[图 6(a)],最大冰
而少吸收的辐射量值基本相当,因此虽然增加降水 厚降至 0. 35 m,开始结冰的日期延后、冰完全融化
提高了冬季湖表的反照率,但冰期湖温上升现象依 的时间提前,整个冰期因此缩短[图 6(b)]。由于冰
然维持[图6(a)]。 期缩短,冰在 3 月 22 日左右完全融化,而此时气温
当用 K 湖较强的向下长波辐射做驱动时,开始 较低,所以在 3 月 22 日湖温会出现小幅度下降
结冰的日期与观测值更为吻合,进入湖泊内部的热 [图6(a)]。