


Page 179 - 《爆炸与冲击》2026年第11期
P. 179
第 46 卷     李    展,等: 甲烷-空气爆燃驱动的爆炸荷载模拟装置研发Ⅰ:几何形式与结构设计                           第 11 期

                 180                             1.9                            140

                                                 1.8                            120
                 160                             1.7                            100
                Pressure/kPa  140              Density/(kg·m −3 )  1.6        Velocity/(m·s −1 )  80
                                                 1.5
                                                                                 60
                                                 1.4
                                                                                 40
                 120
                                                 1.2
                 100                             1.3                             20 0
                                                 1.1                            −20
                    0  10 20 30 40 50 60 70 80     0  10 20 30 40 50 60 70 80     0  10 20 30 40 50 60 70 80
                             Time/ms                        Time/ms                        Time/ms
                      (a) Pressure-time history      (b) Density-time history       (c) Velocity-time history
                                                     图 5    入口边界条件
                                               Fig. 5    Boundary conditions of the inlet

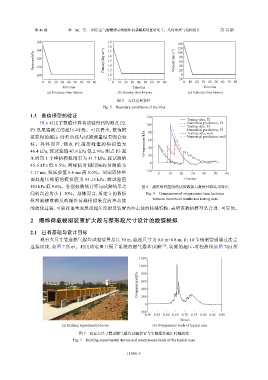
                1.3    数值模型的验证                                    120               Testing data, P2
                   图  6  对比了数值计算和试验得到的测点              P2、         100               Numerical prediction, P2
                                                                                    Testing data, P3
               P3  及尾端测点的超压-时程。可以看出,数值模                            80               Numerical prediction, P3
                                                                                    Testing data, wall
               拟获得的超压-时程曲线与试验测量结果吻合较                               60               Numerical prediction, wall
               好  。  具  体  而  言  , 测  点  P2  超  压  峰  值  的  模  拟  值  为  Overpressure kPa
               46.4 kPa,较试验值    47.8 kPa 低  2.9%;测点  P3  超         40
               压的第   1  个峰值模拟结果为        41.7 kPa,较试验值              20
               45.6 kPa  低  8.5%;两峰值时间间隔的预测值为                       0
                                                                  −20
               7.17 ms,较试验值    6.6 ms 高  8.6%。尾端墙体壁                    0    10   20   30   40   50   60
               面处超压峰值的模拟值为             93.15 kPa,较试验值                              Time/ms
               103 kPa 低  9.6%。各指标数值计算与试验结果之                    图 6    超压时程曲线的试验数据与数值计算结果对比
               间的误差均小于        10%。总体而言,所建立的数值                     Fig. 6    Comparison of overpressure-time histories
               模型能够准确反映爆炸荷载模拟装置内冲击波                                  between numerical results and testing data
               的演化过程,可较好地重现尾部超压反射及装置内冲击波的传播特性,表明该数值模型是合理、可靠的。

                2    爆炸荷载模拟装置扩大段与整形段尺寸设计的数值模拟


                2.1    已有基础与设计目标
                   现有大尺寸管道燃气爆炸试验装置总长                   30 m,截面尺寸为      0.8 m×0.8 m,由  10  节钢制管道通过法兰
               连接组成,如图       7  所示。利用该装置开展了系统的燃气爆炸试验                     [17] ,实测的超压-时程曲线如图          7(b) 所

                                                              1 200

                                                              1 000
                                                                800
                                                              Overpressure/kPa  600

                                                                400
                                                                200

                                                                 0
                                                               −200
                                                                 0.50 0.55 0.60 0.65 0.70 0.75 0.80 0.85 0.90
                                                                                 Time/s
                             (a) Existing experimental device        (b) Overpressure loads of typical case

                                    图 7    已有大尺寸管道燃气爆炸试验装置与实测爆炸超压时程曲线
                                 Fig. 7    Existing experimental device and overpressure loads of the typical case


                                                         115401-5

