


Page 73 - 《爆炸与冲击》2026年第3期
P. 73
第 46 卷             罗    贤,等: 一种新型胸部物理模型的设计及冲击响应分析                               第 7 期


                                                                   25
                     12.5     Boundary                                     Boundary
                              Simulation                                   Simulation
                     10.0     Experiment                           20      Experiment
                    Displacement/mm  7.5                          Displacement/mm  15


                                                                   10
                      5.0

                      2.5                                           5

                       0        0.5     1.0     1.5     2.0         0       0.5      1.0     1.5     2.0
                                      Time/ms                                      Time/ms
                          (c) Chest displacement curve at 56.0 m/s     (d) Chest displacement curve at 86.5 m/s
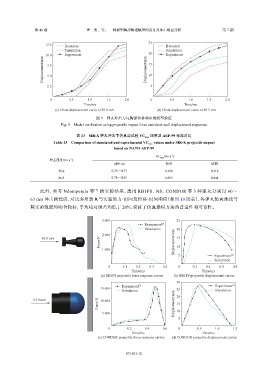
                                            图 9    弹丸冲击力与胸部位移响应的模型验证
                            Fig. 9    Model verification using projectile impact force and chest wall displacement responses


                                                                   x
                                   表 13    SIR-X  弹丸冲击下仿真与试验   VC ma 结果及  AEP-99  标准对比
                         Table 13    Comparison of simulated and experimental VC max  values under SIR-X projectile impact
                                                    based on NATO AEP-99
                                                                             −1
                                                                      VC max /(m·s )
                                −1
                       冲击速度/(m·s )
                                                    AEP-99                仿真                   试验
                           56.0                    0.28~0.33              0.308                0.312
                           86.5                    0.78~0.85              0.803                0.844

                   此外,参考     Ndompetelo  等  [7]  的实验结果,选用     RB1FS、NS、CONDOR       等  3  种弹丸分别以      60~
               63 m/s 冲击刚性墙,对比多组仿真与实验的力-时间及位移-时间响应(如图                            10  所示),各弹丸仿真曲线与

               其实验数据均吻合较好,平均相对误差均低于                    20%,验证了仿真建模方法的普适性和可靠性。


                                              3 000                            25
                                                                 Experiment [7]
                                                                 Simulation    20
                                             Force/N 2 000                    Displacement/mm
                    60.0 m/s                                                   15

                                              1 000                            10
                                                                                5
                                                                                                Experiment
                                                                                                Simulation  [7]
                                                 0     0.1   0.2   0.3   0.4    0      0.2  0.4   0.6   0.8
                                                            Time/ms                        Time/msTime/ms
                                              (a) RB1FS projectile force response curves  (b) RB1FS projectile displacement curves
                                                                               30
                                                       Experiment [7]                            Experiment [7]
                                              15 000
                                                       Simulation                                Simulation
                                            Force/N                           Displacement/mm 25
                63.0 m/s                      10 000                           20
                                                                               15
                                              5 000                            10
                                                                                5

                                                 0       0.2     0.4     0.6    0        0.5    1.0     1.5
                                                            Time/ms                        Time/ms
                                            (c) CONDOR projectile force response curves  (d) CONDOR projectile displacement curves


                                                         071501-12

