


Page 77 - 《爆炸与冲击》2026年第3期
P. 77
第 46 卷             罗    贤,等: 一种新型胸部物理模型的设计及冲击响应分析                               第 7 期

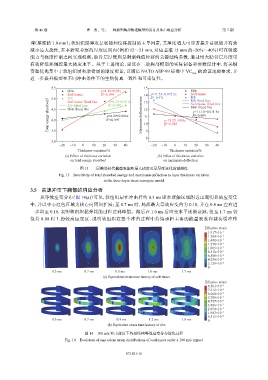
               理(基准值    1.0 mm);软组织层厚度是吸能和位移控制的主导因素,其厚度增大可显著提升总吸能并有效
               减小最大挠度,在本研究考察的厚度区间内(例如                      12~21 mm,对应基准      15 mm  的–20%~40%)可在吸能
               能力与挠度控制之间实现权衡;肋骨层厚度则是限制峰值位移的关键结构参数,通过增大肋骨层厚度可
               有效降低并调控最大挠度水平。基于上述结论,建议在三肋胸部模型的实际制备和参数设计中,将关键
               资源优先集中于软组织层和肋骨层的厚度配置,以满足                         NATO AEP-99  标准中    VC  x  的验证走廊要求,并
                                                                                      ma
               进一步提升模型在不同冲击条件下的生物仿真一致性和可重复性。

                        5.5                                      15

                               Skin           y=4.19+0.03x                            Skin
                                                                    y=11.55−0.072 5x
                               Soft tissue    R =0.994           14  R =0.971         Soft tissue
                                               2
                                                                                      Rib
                               Rib
                                                                     2
                        5.0
                      Total energy absorbed/J  4.5  Rib fitted line  R =0.997  Maximum deflection/mm  12  y=11.25−0.04x  Skin fitted line
                                                                                      Rib fitted line
                                                 y=4.22+0.011x
                               Soft tissue fitted line
                                                                 13
                                                                                      Soft tissue fitted line
                                                 R =0.990
                                                  2
                               Skin fitted line
                                                                                       y=11.14−0.011 5x
                                                                                      R =0.989
                                                                                       2
                                                y=4.20+0.006x
                                                                 11
                        4.0
                                                 2
                                                                          R =0.985
                                                                 10
                                                                           2
                        3.5
                                                                  8 9
                        3.0
                           −20  −10   0   10   20  30   40          −20  −10  0    10  20   30   40
                                    Thickness variation/%                   Thickness variation/%
                              (a) Effect of thickness variation        (b) Effect of thickness variation
                                on total energy absorbed                  on maximum deflection
                                    图 13    三层胸部替代模型吸能和最大挠度对层厚度变化的敏感性
                           Fig. 13    Sensitivity of total absorbed energy and maximum deflection to layer thickness variation
                                               in the three-layer chest surrogate model
                3.5    高速冲击下胸部的响应分析
                   从等效应变分布(图         14(a))可见,软组织层在冲击后约            0.3 ms 即在接触区域附近出现明显的应变集
               中,并以中心红色区域为核心向周围扩展;至                    0.7 ms 时,局部最大等效应变约为           0.10,并在  0.8 ms 左右进
               一步增至    0.18,表明软组织黏弹耗能过程达到峰值。随后在                     1.0 ms 后应变水平逐渐衰减,但至            1.7 ms 仍
               保持  0.08  以上的较高应变区,说明软组织在整个冲击过程中持续承担主要的能量吸收和载荷缓冲作
                                                                                            Effective strain

                                                                                             1.917×10 −1
                                                                                             1.704×10 −1
                                                                                             1.491×10 −1
                                                                                             1.278×10 −1
                                                                                             1.065×10 −1
                                                                                             8.518×10 −2
                                                                                             6.388×10 −2
                                                                                             4.259×10 −2
                                                                                             2.129×10 −2
                                                                                             0
                        0.3 ms        0.7 ms        0.8 ms         1.0 ms         1.7 ms
                                               (a) Equivalent strain time history of soft tissue
                                                                                            Effective strain
                                                                                             8.563×10 −3
                                                                                             7.612×10 −3
                                                                                             6.660×10 −3
                                                                                             5.709×10 −3
                                                                                             4.757×10 −3
                                                                                             3.806×10 −3
                                                                                             2.854×10 −3
                                                                                             1.903×10 −3
                                                                                             9.515×10 −4
                        0.3 ms        0.7 ms         0.9 ms        1.2 ms         1.8 ms     0
                                                 (b) Equivalent strain time history of ribs
                                       图 14    100 m/s 冲击速度下各层结构等效应变分布演化过程
                              Fig. 14    Evolution of equivalent strain distributions of each layer under a 100 m/s impact

                                                         071501-16

