
Page 147 - 《运动与健康科学》(英文)2024年第2期
P. 147
TaggedAPTARAFigure TaggedAPTARAEndMotor units’ adaptations to disuse and active recovery 269
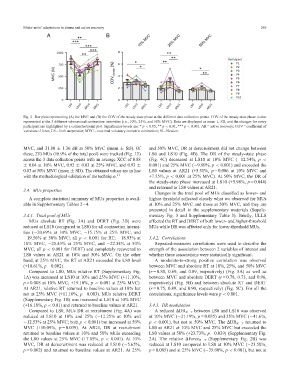
Fig. 2. Bar plots representing (A) the MVC and (B) the COV of the steady state phase at the different data collection points. COV of the steady state phase is also
represented at the 3 different submaximal contraction intensities (i.e., 10%, 25%, and 50% MVC). Data are displayed as mean § SD, and the changes for every
participant are highlighted by a connected point plot. Significance levels are: * p < 0.05, ** p < 0.01, *** p < 0.001. AR = active recovery; COV = coefficient of
variation of force; LS = limb suspension; MVC = maximal voluntary isometric contraction; N = Newton.TaggedAPTARAEnd
MVC, and 31.80 § 1.36 dB at 50% MVC (mean § SD). Of and 50% MVC, DR at derecruitment did not change between
these, 270 MUs (18.9% of the total pool) were tracked (Fig. 1E) LS0 and LS10 (Fig. 4B). The DR of the steady-state phase
across the 3 data collection points with an average XCC of 0.88 (Fig. 4C) decreased at LS10 at 10% MVC (12.54%, p <
§ 0.04 at 10% MVC, 0.92 § 0.03 at 25% MVC, and 0.93 § 0.001) and 25% MVC (9.80%, p < 0.001) and exceeded the
0.03 at 50% MVC (mean § SD). The obtained values are in line LS0 values at AR21 (+5.51%, p = 0.006 at 10% MVC and
11
with the methodological validation of the technique. TaggedAPTARAEnd +7.35%, p < 0.001 at 25% MVC). At 50% MVC, the DR of
the steady-state phase increased at LS10 (+5.98%, p = 0.044)
and returned to LS0 values at AR21.TaggedAPTARAEnd
TaggedAPTARAH23.4. MUs propertiesTaggedAPTARAEnd
TaggedAPTARAPChanges in the total pool of MUs classified as lower- and
TaggedAPTARAPA complete statistical summary of MUs properties is avail- higher-threshold reflected closely what we observed for MUs
at 10% and 25% MVC and those at 50% MVC, and they are
able in Supplementary Tables 24.TaggedAPTARAEnd
presented in detail in the supplementary materials (Supple-
mentary Fig. 3 and Supplementary Table 3). Briefly, ULLS
TaggedAPTARAP3.4.1. Total pool of MUsTaggedAPTARAEnd
TaggedAPTARAPMUs absolute RT (Fig. 3A) and DERT (Fig. 3B) were affected the RT and DERT of both lower- and higher-threshold
reduced at LS10 (compared to LS0) for all contraction intensi- MUs while DR was affected only for lower-threshold MUs.TaggedAPTARAEnd
ties (20.69% at 10% MVC, 15.15% at 25% MVC, and
19.56% at 50% MVC; all p < 0.001 for RT; 18.93% at TaggedAPTARAP3.4.2. CorrelationsTaggedAPTARAEnd
10% MVC, 25.43% at 25% MVC, and 22.34% at 50% TaggedAPTARAPRepeated-measures correlations were used to describe the
MVC; all p < 0.001 for DERT) and completely recovered to strength of the association between 2 variables of interest and
LS0 values at AR21 at 10% and 50% MVC. On the other whether these associations were statistically significant.TaggedAPTARAEnd
hand, at 25% MVC, the RT at AR21 exceeded the LS0 level TaggedAPTARAPA moderate-to-strong positive correlation was observed
between MVC and absolute RT at 10%, 25%, and 50% MVC
(+10.61%, p = 0.002).TaggedAPTARAEnd
TaggedAPTARAPCompared to LS0, MUs relative RT (Supplementary Fig. (r = 0.80, 0.69, and 0.89, respectively) (Fig. 5A) as well as
1A) was increased at LS10 at 10% and 25% MVC (+11.10%, between MVC and absolute DERT (r = 0.78, 0.73, and 0.96,
p = 0.008 at 10% MVC; +19.10%, p < 0.001 at 25% MVC). respectively) (Fig. 5B) and between absolute RT and DERT
At AR21, relative RT returned to baseline values at 10% but (r = 0.75, 0.89, and 0.90, respectively) (Fig. 5C). For all the
not at 25% MVC (+11.10%, p = 0.003). MUs relative DERT correlations, significance levels were p < 0.001.TaggedAPTARAEnd
(Supplementary Fig. 1B) was increased at LS10 at 10% MVC
(+16.10%, p < 0.01) and returned to baseline values at AR21.TaggedAPTARAEnd TaggedAPTARAP3.4.3. DR modulationTaggedAPTARAEnd
TaggedAPTARAPCompared to LS0, MUs DR at recruitment (Fig. 4A) was TaggedAPTARAPA reduced DDR RT between LS0 and LS10 was observed
reduced at LS10 at 10% and 25% (12.25% at 10% and at 10% MVC (21.19%, p = 0.035) and 25% MVC (41.6%,
12.53% at 25% MVC; both p < 0.001) but increased at 50% p < 0.001), but not at 50% MVC. The DDR RT returned to
MVC (+10.09%, p = 0.039). At AR21, DR at recruitment LS0 at AR21 at 10% MVC and 25% MVC but exceeded the
returned to baseline values at 10% and 50% while exceeding LS0 values at 50% (+23.73%, p = 0.039) (Supplementary Fig.
the LS0 values at 25% MVC (+7.05%, p < 0.001). At 10% 2A). The relative DForce RT (Supplementary Fig. 2B) was
MVC, DR at derecruitment was reduced at LS10 (5.65%, reduced at LS10 compared to LS0 at 10% MVC (23.50%,
p = 0.002) and returned to baseline values at AR21. At 25% p = 0.005) and at 25% MVC (35.00%, p < 0.001), but not at