
Page 144 - 《运动与健康科学》(英文)2024年第2期
P. 144
TaggedAPTARAFigure
TaggedAPTARAEnd266 G. Valli et al.
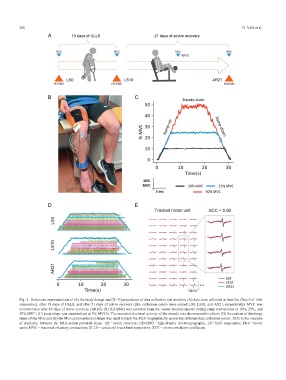
Fig. 1. Schematic representation of (A) the study design and (BE) procedures of data collection and analysis. (A) data were collected at baseline (Day 0 of limb
suspension), after 10 days of ULLS, and after 21 days of active recovery (data collection points were named LS0, LS10, and AR21, respectively). MVC was
recorded also after 10 days of active recovery (AR10); (B) HD-EMG was recorded from the vastus lateralis muscle during ramp contractions at 10%, 25%, and
50% MVC; (C) ramp slope was standardized at 5% MVC/s. The recorded electrical activity of the muscle was decomposed to obtain (D) the pattern of discharge
times of the MUs and (E) the MUs action potential shape was used to track the MUs longitudinally across the different data collection points. XCC is the measure
of similarity between the MUs action potential shape. AR = active recovery; HD-EMG = high-density electromyography; LS = limb suspension; MUs = motor
units; MVC = maximal voluntary contraction; ULLS = unilateral lower limb suspension; XCC = cross-correlation coefficient.TaggedAPTARAEnd