
Page 184 - 卫星导航2021年第1-2合期
P. 184
Zhang et al. Satell Navig (2021) 2:11 Page 8 of 10
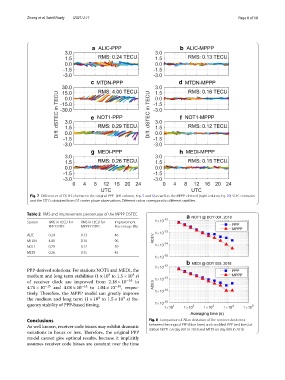
Fig. 7 Diferences of DSTECs between the original PPP- (left column, Eqs. 5 and 6) as well as the MPPP-derived (right column, Eq. 10) STEC estimates
and the STECs obtained from GF carrier phase observations. Diferent colors correspond to diferent satellites
Table 2 RMS and improvement percentage of the MPPP-DSTEC
Station RMS in TECU for RMS in TECU for Improvement
PPP DSTEC MPPP DSTEC Percentage (%)
ALIC 0.24 0.13 46
MTDN 4.00 0.16 96
NOT1 0.29 0.12 59
MEDI 0.26 0.15 42
PPP-derived solutions. For stations NOT1 and MEDI, the
4
4
medium and long term stabilities (1 × 10 to 1.5 × 10 s)
of receiver clock are improved from 2.18 × 10 −14 to
4.75 × 10 −15 and 4.08 × 10 −14 to 1.04 × 10 −14 , respec-
tively. Terefore, the MPPP model can greatly improve
4
4
the medium and long term (1 × 10 to 1.5 × 10 s) fre-
quency stability of PPP-based timing.
Conclusions Fig. 8 Comparison of Allan deviation of the receiver clock error
As well known, receiver code biases may exhibit dramatic between the original PPP (blue lines) and modifed PPP (red lines) at
variations in hours or less. Terefore, the original PPP station NOT1 on day 001 in 2018 and MEDI on day 009 in 2018
model cannot give optimal results, because it implicitly
assumes receiver code biases are constant over the time