
Page 181 - 卫星导航2021年第1-2合期
P. 181
Zhang et al. Satell Navig (2021) 2:11 Page 5 of 10
the two sets of STEC results derived with the two PPP combinations of P1 and P2 code bias variations also
models (Hernández-Pajares et al. 2017; Roma-Dollase have a strong correlation with the intraday tempera-
2018). ture (red lines), which is consistent with the previous
Fourthly, in order to validate the feasibility and efec- research (Zha et al. 2019). Note that the variation values
tiveness of the MPPP model in timing, the Allan DEVia- of receiver code biases and their GF/IF combinations
tion (ADEV) was used to evaluate the frequency stability in subplots (c), (d), (e) and (f) in Fig. 1 were reversed to
of the receiver clock solutions. make them consistent with the variations of temperature.
Terefore, their variation series look consistent with the
Intraday variations of receiver code biases temperature, but their PCC values are negative.
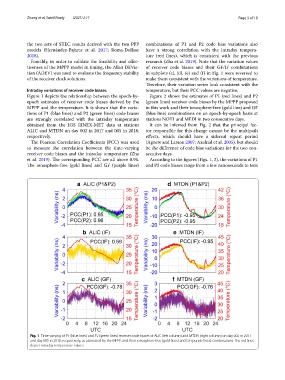
Figure 1 depicts the relationship between the epoch-by- Figure 2 shows the estimates of P1 (red lines) and P2
epoch estimates of receiver code biases derived by the (green lines) receiver code biases by the MPPP proposed
MPPP and the temperature. It is shown that the varia- in this work and their ionosphere-free (gold line) and GF
tions of P1 (blue lines) and P2 (green lines) code biases (blue line) combinations on an epoch-by-epoch basis at
are strongly correlated with the intraday temperature stations NOT1 and MEDI in two consecutive days.
obtained from the IGS RINEX-MET data at stations It can be inferred from Fig. 2 that the principal fac-
ALIC and MTDN on day 002 in 2017 and 005 in 2018, tor responsible for this change cannot be the multipath
respectively. efects, which should have a sidereal repeat period
Te Pearson Correlation Coefcients (PCC) was used (Agnew and Larson 2007; Axelrad et al. 2005), but should
to measure the correlation between the time-varying be the diference of code bias variations for the two con-
receiver code biases and the intraday temperature (Zha secutive days.
et al. 2019). Te corresponding PCC are all above 0.95. According to the fgures (Figs. 1, 2), the variations of P1
Te ionosphere-free (gold lines) and GF (purple lines) and P2 code biases range from a few nanoseconds to tens
Fig. 1 Time-varying of P1 (blue lines) and P2 (green lines) receiver code biases of ALIC (left column) and MTDN (right column) on day 002 in 2017
and day 005 in 2018, respectively, as estimated by the MPPP, and their ionosphere-free (gold lines) and GF (purple lines) combinations. The red lines
depict intraday temperature values