
Page 254 - 《水产学报》2026年第04期
P. 254
4 期 水 产 学 报 50 卷
盐度/PSU
N N N
salinity
31.8° 31.8° 31.8°
30
31.6° 31.6° 31.6°
31.4° 31.4° 31.4° 20
31.2° 31.2° 31.2° 10
121° 122° 123° 124° E 121° 122° 123° 124° E 121° 122° 123° 124° E
(a) (b) (c)
水温/°C
N N N
water temperature
31.8° 31.8° 31.8° 30
31.6° 31.6° 31.6°
25
31.4° 31.4° 31.4°
20
31.2° 31.2° 31.2°
15
121° 122° 123° 124° E 121° 122° 123° 124° E 121° 122° 123° 124° E
(d) (e) (f)
春 spring 夏 summer 秋 autumn
30 30 35
盐度/PSU salinity 20 盐度/PSU salinity 20 盐度/PSU salinity 25
30
25
25
20
15
15
10
10
15
5
121 122 123 124 5 121 122 123 124 10 121 122 123 124
经度/°E 经度/°E 经度/°E
longitude longitude longitude
(g) 秋 autumn
盐度梯度/(PSU/km) salinity gradient 0.4 盐度梯度/(PSU/km) salinity gradient 0.8 盐度梯度/(PSU/km) salinity gradient 0.6
夏 summer
春 spring
0.6
0.3
0.4
0.4
0.2
0.2
0.2
0.1
122
123
121
经度/°E 124 121 122 123 124 121 122 123 124
经度/°E
经度/°E
longitude longitude longitude
(h)
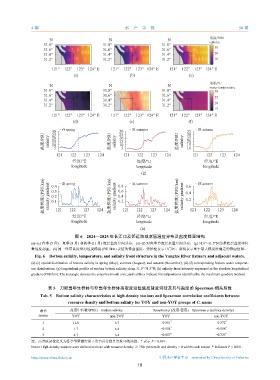
图 6 2024—2025 年长江口及邻近海域底层温盐分布及盐度锋面结构
(a)~(c) 春季 (5 月)、夏季 (8 月) 和秋季 (11 月) 底层盐度空间分布;(d)~(f) 对应季节底层水温空间分布;(g) 31.0°~31.5°N 纬带底层盐度中位
数经度剖面;(h) 同一纬带盐度绝对经度梯度 (PSU/km) 表征的锋面强度。矩形框表示口门区;虚线表示基于最大梯度法确定的锋面位置。
Fig. 6 Bottom salinity, temperature, and salinity front structure in the Yangtze River Estuary and adjacent waters.
(a)-(c) spatial distribution of bottom salinity in spring (May), summer (August), and autumn (November); (d)-(f) corresponding bottom water temperat-
ure distributions; (g) longitudinal profile of median bottom salinity along 31.0°-31.5°N; (h) salinity front intensity expressed as the absolute longitudinal
gradient (PSU/km). The rectangle denotes the estuarine mouth zone;dashed lines indicate frontal positions identified by the maximum-gradient method.
表 5 刀鲚当年生群体与非当年生群体高密度站位底层盐度特征及其与盐度的 Spearman 相关系数
Tab. 5 Bottom salinity characteristics at high-density stations and Spearman correlation coefficients between
resource density and bottom salinity for YOY and non-YOY groups of C. nasus
季节 盐度中位数/(PSU) median salinity Spearman ρ (盐度-密度) Spearman ρ (salinity-density)
season YOY non-YOY YOY non-YOY
* *
1 11.0 6.7 −0.561 −0.572
* *
2 1.7 6.4 −0.554 −0.508
3 4.7 6.4 −0.807 * −0.725 *
注:高密度站位定义为各季节资源密度≥第75百分位且密度>0的站位。* 表示 P < 0.001。
Notes: High-density stations were defined as those with resource density ≥ 75th percentile and density > 0 within each season. * indicates P < 0.001.
https://www.china-fishery.cn 中国水产学会主办 sponsored by China Society of Fisheries
10