
Page 139 - 《水产学报》2026年第2期
P. 139
2 期 水 产 学 报 50 卷
站位数/个 size 9 12 15
鱼类 头足类 虾类 蟹类
fish cephalopods shrimp crab
18 6 2.0 6
1.5
14 4 4 2014 春季
1.0
10 2 2 spring
0.5
6 0 0 0
D1D2D3D4D5D6 D1D2D3D4D5D6 D1D2D3D4D5D6 D1D2D3D4D5D6
(a) (b) (c) (d)
20 4 30 20
15 3 24 16
2014 秋季
10 2 18 12 autumn
5 1 12 8
D1D2D3D4D5D6 D1D2D3D4D5D6 D1D2D3D4D5D6 D1D2D3D4D5D6
(e) (f) (g) (h)
24 1.5 12 30
18 1.0 9 22
2018 春季
12 0.5 6 14
spring
6 0 3 6
D1D2D3D4D5D6 D1D2D3D4D5D6 D1D2D3D4D5D6 D1D2D3D4D5D6
(i) (j) (k) (l)
REE
15 0.4 20 16
0.3
12 16 12
0.2 2018 秋季
9 12 8
0.1 autumn
6 0 8 4
D1D2D3D4D5D6 D1D2D3D4D5D6 D1D2D3D4D5D6 D1D2D3D4D5D6
(m) (n) (o) (p)
32 40 12 16
24 30 12
7 2020 秋季
16 20 8
autumn
8 10 2 4
D1D2D3D4D5D6
D1D2D3D4D5D6 D1D2D3D4D5D6 D1D2D3D4D5D6 D1D2D3D4D5D6
(p) (r) (s) (t)
12 40 32 4
9 30 24 3
2021 春季
6 20 16 2
spring
3 10 8 1
D1D2D3D4D5D6 D1D2D3D4D5D6 D1D2D3D4D5D6 D1D2D3D4D5D6
(u) (v) (w) (x)
站位设计
station designs
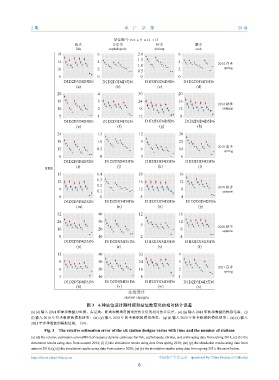
图 3 6 种站位设计随时间和站位数变化的相对估计误差
(a) (d) 输入 2014 年春季数据对鱼类、头足类、虾类和蟹类资源密度估计值的相对估计误差;(e) (h) 输入 2014 年秋季数据的模拟结果;(i)
(l) 输入 2018 年春季数据的模拟结果;(m) (p) 输入 2018 年秋季数据的模拟结果;(q) (t) 输入 2020 年秋季数据的模拟结果;(u) (x) 输入
2021 年春季数据的模拟结果;下同。
Fig. 3 The relative estimation error of the six station designs varies with time and the number of stations
(a) (d) the relative estimation errors(REE) of resource density estimates for fish, cephalopods, shrimp, and crabs using data from spring 2014; (e) (h) the
simulation results using data from autumn 2014; (i) (l) the simulation results using data from spring 2018; (m) (p) the simulation results using data from
autumn 2018; (q) (t) the simulation results using data from autumn 2020; (u) (x) the simulation results using data from spring 2021; the same below.
https://www.china-fishery.cn 中国水产学会主办 sponsored by China Society of Fisheries
6