Page 136 - 《水产学报》2026年第2期
P. 136

2 期                梁耀威,等:站位设计对北部湾产卵场海域渔业资源密度评估的影响                                        50 卷


                             N
                       21°30′
                                                                                       2021春季
                                                                                       spring 2021
                                                                                       2018春季
                                                                                       spring 2018
                                                                                       2014春季
                         21°
                                                                                       spring 2014
                                                                                       2020秋季
                                                                                       autumn 2020
                                                                                       2018秋季
                                                                                       autumn 2018
                                                                                       2014秋季
                       20°30′                                                          autumn 2014
                                                                                       实验区
                                                                                       experimental area
                                                                                       核心区
                                                                                       core area
                                                                               N
                                                                               ¯   0   20   40
                         20°                                                                  km
                           108°         108°30′       109°        109°30′       110°E
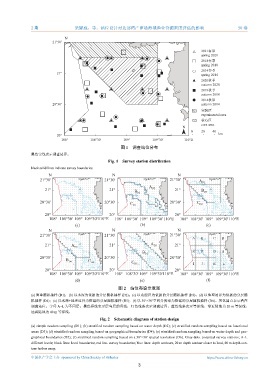
                                                     图 1    调查站位分布
              黑色实线表示调查边界。
                                               Fig. 1 Survey station distribution
              black solid lines indicate survey boundaries.

                      N                          N                           N
                  21°30'                      21°30'                     21°30'       A
                                                                                       D3
                                                                 A
                    21°                         21°       B       D2        21°        B
                                                            D2                          D3
                  20°30'                      20°30'    C                20°30'      C
                                                          D2                          D3

                    20°                         20°                         20°
                      108°  108°30' 109°  109°30' 110°E  108°  108°30'  109°  109°30'  110°E  108°  108°30'  109°  109°30' 110°E
                                 (a)                         (b)                         (c)
                      N                          N                           N
                  21°30'                      21°30'                     21°30'
                                                                                   A   B    C   D
                    21°        A                21°              A D5       21°
                                 D4
                                                              B D5                 E   F    G   H
                  20°30'                      20°30'                     20°30'
                             B D4      C D4              C D5                      I   J    K   L
                    20°                         20°                         20°
                      108°  108°30' 109°  109°30' 110°E  108°  108°30' 109°  109°30' 110°E  108°  108°30'  109°  109°30' 110°E
                                 (d)                         (e)                         (f)
                                                    图 2    站位布设示意图
              (a) 简单随机抽样  (D1);(b) 以水深为依据的分层随机抽样     (D2);(c) 以功能区为依据的分层随机抽样      (D3);(d) 以地理边界为依据的分层随
              机抽样  (D4);(e) 以水深+地理边界为依据的分层随机抽样       (D5);(f) 以  30′×30′空间分辨率为依据的分层随机抽样   (D6)。灰色圆点表示潜在
              调查站位;字母     A~L  为不同层;黑色框线表示层与层的界线;红色线条表示调查边界;蓝色线条表示等深线,靠近陆地为                       20 m  等深线,
              远离陆地为   40 m  等深线。
                                            Fig. 2 Schematic diagram of station design
              (a) simple random sampling (D1); (b) stratified random sampling based on water depth (D2); (c) stratified random sampling based on functional
              areas (D3); (d) stratified random sampling based on geographical boundaries (D4); (e) stratified random sampling based on water depth and geo-
              graphical boundaries (D5); (f) stratified random sampling based on a 30′×30′ spatial resolution (D6). Gray dots. potential survey stations; A-L.
              different levels; black lines. level boundaries; red line. survey boundaries; blue lines. depth contours, 20 m depth contour closer to land, 40 m depth con-
              tour farther away.

              中国水产学会主办  sponsored by China Society of Fisheries                          https://www.china-fishery.cn
                                                            3
   131   132   133   134   135   136   137   138   139   140   141