Page 201 - 《水产学报》2026年第01期
P. 201

1 期                     黄晓曼,等:食源性铁过载诱导草鱼肝细胞的损伤机制                                         50 卷

                                                                      0 μmol/L      250 μmol/L   500 μmol/L
              一步检测了相关抗氧化基因的转录水平。结果显
              示,核因子       E2  相关因子    (nrf2)、血红素加氧酶-
              1(ho-1) 和  gpx4  的  mRNA  转录水平随着铁浓度的
                                                                  100 μm       100 μm       100 μm
              升高均极显著上调         (P<0.01,图   3-h~j)。                          1             2            3
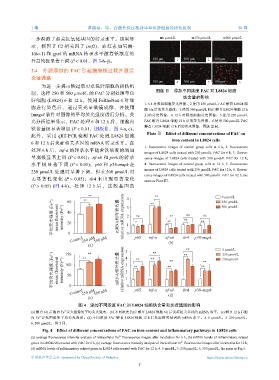
               2.4    外源添加的 FAC     引起细胞铁过载并激活
              炎症通路
                                                                  100 μm    4  100 μm     5  100 μm    6
                   为进一步揭示铁过载对草鱼肝细胞的损伤机
                                                                   图版 Ⅱ    添加不同浓度      FAC  对  L8824  细胞
              制,选择     250  和  500 μmol/L  的  FAC  分别处理草鱼
                                                                               铁含量的影响
              肝细胞    (L8824) 6  和  12 h。使用  FeRhoNox-1  对细
                                                               1. 6 h  对照组细胞荧光图像,2.使用  250 μmol/L FAC  孵育  L8824  细
              胞进行染色后,通过荧光显微镜成像,并使用                             胞  6 h  后的荧光图像,3.使用  500 μmol/L FAC  孵育  L8824  细胞  12 h
              ImageJ 软件对图像的平均荧光强度进行分析。荧                        后的荧光图像,4. 12 h  对照组细胞荧光图像,5.使用       250 μmol/L
              光分析结果显示,FAC          处理   6  和  12 h  后,细胞内      FAC  孵育  L8824  细胞  12 h  后的荧光图像,6.使用  500 μmol/L FAC
              铁含量极显著增加          (P<0.01,图版Ⅱ,图       4-a, c)。   孵育  L8824  细胞  12 h  后的荧光图像,图版 Ⅲ同。
              此外,采用       qRT-PCR  检测  FAC  处理  L8824  细胞       Plate Ⅱ Effect of different concentrations of FAC on
                                                                           iron content in L8824 cells
              6  和  12 h  后炎症相关基因的      mRNA  转录水平。在
                                                               1.  fluorescence  images  of  control  group  cells  at  6  h,  2.  fluorescence
              处理   6 h  后,tnf-α  的转录水平随着铁浓度的增加
                                                               images of L8824 cells treated with 250 μmol/L FAC for 6 h, 3. fluores-
              呈现极显著上调         (P<0.01);nf-κb  和  perk 的转录      cence  images  of  L8824  cells  treated  with  500  μmol/L  FAC  for  12  h,
              水 平 极 显 著 下 调    (P< 0.01); p65  和  p38-mapk 在   4.  fluorescence  images  of  control  group  cells  at  12  h,  5.  fluorescence
              250 μmol/L  处理时显著下调,但在500 μmol/L          时      images of L8824 cells treated with 250 μmol/L FAC for 12 h, 6. fluores-
                                                               cence images of L8824 cells treated with 500 μmol/L FAC for 12 h, the
              无显著性变化         (P>0.05);tlr4  未出现显著变化
                                                               same as Plate Ⅲ.
              (P> 0.05)  (图  4-b)。 处 理  12  h  后 , 这 些 基 因 的

                                       **              4         ** **                          0 μmol/L
                                                                                                250 μmol/L
                                     **
                        平均荧光强度 (Fe 2+ )  mean fluoresent  intensity (Fe 2+ )  40  mRNA相对表达量 relative mRNA expression  3  * ns  ** **  ns ns  ** ns
                              60
                                                                                                500 μmol/L
                                                       2
                              20
                                                       1
                              0
                               Control 250 μM 500 μM   0   p65   tnf-α  nf-κb  tlr4  p38-mapk
                                                                         (b)
                                       (a)             5          **            ** **           0 μmol/L
                                                                                                250 μmol/L
                        平均荧光强度 (Fe 2+ )  mean fluoresent  intensity (Fe 2+ )  100  **  mRNA相对表达量 relative mRNA expression  4 3 2 1  ** **  **  ** **  ** **  500 μmol/L
                             150
                                      **

                              50

                               0
                               Control 250 μM 500 μM   0   p65   tnf-α  nf-κb  tlr4  p38-mapk
                                       (c)                               (d)
                                   图 4    添加不同浓度   FAC  对  L8824  细胞铁含量和炎症通路的影响
                            2+
              (a) 孵育  6 h  后胞内  Fe 荧光图像的平均荧光强度,(b) 不同浓度  FAC  孵育  L8824  细胞  6 h  后炎症相关基因的  mRNA  水平,(c) 孵育  12 h  后胞
                  2+
              内  Fe 荧光图像的平均荧光强度,(d) 不同浓度       FAC  孵育  L8824  细胞  12 h  后炎症相关基因的  mRNA  水平。4. 0 μmol/L,5. 250 μmol/L,
              6. 500 μmol/L,图  5  同。
                   Fig. 4 Effect of different concentrations of FAC on iron content and inflammatory pathways in L8824 cells
                                                    2+
              (a) average fluorescence intensity analysis of intracellular Fe  fluorescence images after incubation for 6 h, (b) mRNA levels of inflammatory related
                                                                              2+
              genes in L8824 cells treated with FAC for 6 h, (c) average fluorescence intensity analysis of intracellular Fe  fluorescence images after incubation for 12 h,
              (d) mRNA levels of inflammatory related genes in L8824 cells treated with FAC for 12 h. 4. 0 μmol/L, 5. 250 μmol/L, 6. 500 μmol/L, the same as Fig.5.
              中国水产学会主办  sponsored by China Society of Fisheries                          https://www.china-fishery.cn
                                                            7
   196   197   198   199   200   201   202   203   204   205   206