Page 72 - 《水产学报》2025年第12期
P. 72

赵春德,等                                                                水产学报, 2025, 49(12): 129306


                        1.00   低值区  lower quantile region          1.00   低值区  lower quantile region
                               中值区  median range
                                                                          中值区  median range
                               高值区  upper quantile region
                                                                          高值区  upper quantile region
                    空间面积占比  spatial area proportion  0.50       空间面积占比  spatial area proportion  0.50
                        0.75
                                                                   0.75
                                                                    0.25
                        0.25
                          0
                            5    6    7    8    9   10   11           0  5  6    7    8    9   10   11
                                         月份                                         月份
                                        month                                      month
                                          (a)                                        (b)
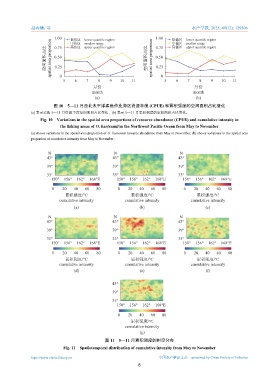
                        图 10    5—11 月西北太平洋柔鱼作业海区资源丰度            (CPUE) 和累积强度的空间面积占比变化
              (a) 表示柔鱼 5—11 月资源丰度空间面积占比变化,(b) 表示 5—11 月累积强度的空间面积占比变化。
                  Fig. 10 Variations in the spatial area proportions of resource abundance (CPUE) and cumulative intensity in
                           the fishing areas of O. bartramii in the Northwest Pacific Ocean from May to November
              (a) shows variations in the spatial area proportion of O. bartramii resource abundance from May to November, (b) shows variations in the spatial area
              proportion of cumulative intensity from May to November.


                      N                           N                           N
                     43°                         43°                         43°
                     39°                         39°                         39°
                     35°                         35°                         35°
                       150°  156°  162°  168°E     150°  156°  162°  168°E     150°  156°  162°  168°E

                       0    20  40   60   80       0    20   40  60   80       0    20   40  60   80
                             累积强度/°C                     累积强度/°C                     累积强度/°C
                          cumulative intensity        cumulative intensity        cumulative intensity
                                 (a)                         (b)                         (c)
                      N                           N                           N
                     43°                         43°                         43°

                     39°                         39°                         39°
                     35°                         35°                         35°
                       150°  156°  162°  168°E     150°  156°  162°  168°E     150°  156°  162°  168°E

                       0    20   40  60   80       0    20   40  60   80       0    20   40  60   80
                             累积强度/°C                     累积强度/°C                     累积强度/°C
                          cumulative intensity        cumulative intensity        cumulative intensity
                                 (d)                         (e)                         (f)

                                                 43°
                                                 39°
                                                 35°
                                                   150°  156°  162°  168°E
                                                   0    20  40   60   80
                                                         累积强度/°C
                                                      cumulative intensity
                                                             (g)
                                              图 11    5—11 月累积强度的时空分布
                            Fig. 11 Spatiotemporal distribution of cumulative intensity from May to November

              https://www.china-fishery.cn                           中国水产学会主办    sponsored by China Society of Fisheries
                                                            8
   67   68   69   70   71   72   73   74   75   76   77