Page 70 - 《水产学报》2025年第12期
P. 70

赵春德,等                                                                水产学报, 2025, 49(12): 129306

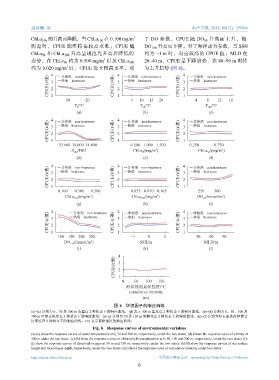
              Chl.a 100  的升高而降低,当 Chl.a    100  在 0.100 mg/m 3  于 DO 参数,CPUE 随 DO  升高而上升,随
                                                                                        50
              附近时,CPUE 能维持在较高水准;CPUE 随                         DO 150  升高而下降。对于海洋动力参数,当 SSH
              Chl.a  和 Chl.a 300  升高呈现出先升高后降低的                 约为 −1 m 时,对应较高的 CPUE 值;MLD 在
                   50
                                             3
              态势,在 Chl.a  约为 0.500 mg/m  以及 Chl.a       300    20~40 m,CPUE 呈下降趋势,在 40~90 m           则转
                            50
                             3
              约为 0.020 mg/m  时,CPUE 处于较高水平。对                   为上升趋势      (图  8)。

                       4   非热浪  non-heatwave       4   非热浪  non-heatwave       4   非热浪  non-heatwave
                      CPUE/(t/艘)  3 2            CPUE/(t/艘)  3 2             CPUE/(t/艘)  3
                                                       热浪  heatwave
                                                                                   热浪  heatwave
                           热浪  heatwave
                                                                               2
                       1
                             10      20            1     5   10  15  20        1    4    8    12   16
                                 T /°C                       T /°C                       T /°C
                                  0                           50                          300
                                  (a)                         (b)                         (c)
                       4   非热浪  non-heatwave       4   非热浪  non-heatwave       4   非热浪  non-heatwave
                      CPUE/(t/艘)  3 2            CPUE/(t/艘)  3 2             CPUE/(t/艘)  3
                                                                                   热浪  heatwave
                                                       热浪  heatwave
                           热浪  heatwave
                                                                               2
                       1
                          33.600 34.000 34.400     1     0.500 1.000  1.500    1  0.250     0.750
                                                                                                3
                                S /PSU                    Chl.a /(mg/m )             Chl.a /(mg/m )
                                                                   3
                                                              0
                                                                                         50
                                300
                                  (d)                         (e)                         (f)
                       4   非热浪  non-heatwave       4   非热浪  non-heatwave       4   非热浪  non-heatwave
                      CPUE/(t/艘)  3 2            CPUE/(t/艘)  3 2             CPUE/(t/艘)  3
                           热浪  heatwave
                                                       热浪  heatwave
                                                                                   热浪  heatwave
                                                                               2
                       1
                          0.100  0.300  0.500      1     0.035 0.070  0.105    1     250    300
                                        3
                                                                    3
                                                                                                3
                             Chl.a / (mg/m )             Chl.a /(mg/m )              DO 50 /(mmol/m )
                                 100                         300
                                  (g)                         (h)                         (i)
                       4        非热浪  non-heatwave  4    非热浪  non-heatwave      4   非热浪  non-heatwave
                      CPUE/(t/艘)  3 2            CPUE/(t/艘)  3 2             CPUE/(t/艘)  3
                                热浪  heatwave
                                                                                   热浪  heatwave
                                                        热浪  heatwave
                                                                               2
                       1
                          100 150 200  250         1     −1     0      1       1     30   60    90
                            DO 150 /(mmol/m )                SSH/m                      MLD/m
                                        3
                                  (j)                         (k)                         (l)
                                                    4
                                                  CPUE/(t/艘)  3 2
                                                    1
                                                     0    50   100  150
                                                       海洋热浪累积强度/°C
                                                        cumulative intensity
                                                              (m)
                                                  图 8    环境因子的响应曲线
              (a)~(c) 分别为 0、50 及 300 m 水温在  2  种状态下的响应曲线,(d) 表示 300 m 盐度在  2  种状态下的响应曲线,(e)~(h) 分别为 0、50、100 及
              300 m 叶绿素浓度在  2  种状态下的响应曲线,(i)~(j) 分别为 50 及 150 m 溶解氧在  2  种状态下的响应曲线,(k)~(l) 分别为海表面高度和混合
              层深度在   2  种状态下的响应曲线,(m) 表示累积强度的响应曲线。
                                         Fig. 8 Response curves of environmental variables
              (a)-(c) show the response curves of water temperatures at 0, 50 and 300 m, respectively, under the two states. (d) shows the response curve of salinity at
              300 m under the two states. (e)-(h) show the response curves of chlorophyll concentrations at 0, 50, 100 and 300 m, respectively, under the two states. (i)-
              (j) show the response curves of dissolved oxygen at 50 m and 150 m, respectively, under the two states. (k)-(l) show the response curves of sea surface
              height and mixed layer depth, respectively, under the two states. (m) shows the response curve of cumulative intensity under two states.

              https://www.china-fishery.cn                           中国水产学会主办    sponsored by China Society of Fisheries
                                                            6
   65   66   67   68   69   70   71   72   73   74   75