Page 68 - 《水产学报》2025年第12期
P. 68

赵春德,等                                                                水产学报, 2025, 49(12): 129306

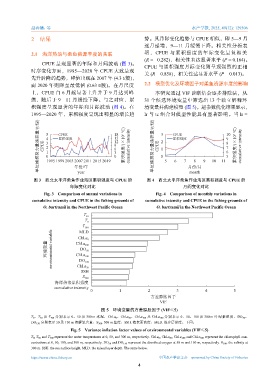
               2    结果                                         势。其月际变化趋势与 CPUE 相似,即 5—9 月
                                                               逐月递增,9—11 月缓慢下降。相关性分析表

               2.1    海洋热浪与柔鱼资源丰度的关联                           明,CPUE 与累积强度的年际变化呈负相关
                                                               (R = −0.282),相关性未达显著水平           (P = 0.164)。
                   CPUE 呈现显著的年际和月间波动                (图  3)。
                                                               CPUE 与累积强度月际变化则呈现强烈的正相
              时序变化方面,1995—2020 年 CPUE 大致呈现
                                                               关  (R = 0.858),相关性达显著水平         (P = 0.013)。
              先升后降的趋势,峰值出现在 2007 年                (4.3 t/艘),
              而 2020 年则降至最低值          (0.63 t/艘)。在月尺度           2.2    模型优化及环境因子对柔鱼资源丰度的影响
              上,CPUE 自 6 月起显著上升并于 9 月达到峰                           本研究通过 VIF 诊断结合逐步排除法,从
              值,随后于 9—11 月缓慢下降。与之对应,累                          31 个候选环境变量中筛选出 13 个独立解释环
              积强度呈现显著的年际和月际波动                    (图  4)。在      境变量并构建模型         (图  5)。超参数优化结果显示,
              1995—2020 年,累积强度呈现出明显的增长趋                        lr 与 tc 组合对模型性能具有显著影响。当 lr =

                 单位捕捞努力量渔获量/(t/艘)  CPUE 4 5 3 2 1 0  CPUE  18 累积强度/(×10 4  ℃)  cumulative intensity  单位捕捞努力量渔获量/(t/艘)  CPUE  3 2 1 0  累积强度  10 累积强度/(×10 3  ℃)  cumulative intensity

                                                                           CPUE
                                                  15
                          累积强度
                                                                                                  9
                                                  12
                                                                                                  8
                                                  9
                                                                                                  7
                                                  6
                                                                                                  6
                                                  3
                                                                                                  5
                                                  0
                                                                                    8
                                 年份/年
                                  year
                                                                                  month
                     1995 1999 2003 2007 2011 2015 2019                5   6    7  月份/月  9  10  11
               图 3    西北太平洋柔鱼作业海区累积强度与 CPUE 的                   图 4    西北太平洋柔鱼作业海区累积强度与 CPUE 的
                               年际变化对比                                          月间变化对比
                    Fig. 3 Comparison of annual variations in      Fig. 4 Comparison of monthly variations in
               cumulative intensity and CPUE in the fishing grounds of  cumulative intensity and CPUE in the fishing grounds of
                   O. bartramii in the Northwest Pacific Ocean      O. bartramii in the Northwest Pacific Ocean

                                     T
                                      50
                                     T 0
                                    T
                                     300
                       environmental variable  Chl.a 100
                                   MLD
                                  Chl.a 0
                     环境变量        Chl.a 300
                                   DO 50
                                   DO 150
                                  Chl.a 50
                                    SSH
                                    S 300
                        海洋热浪累积强度
                        cumulative intensity
                                        0           1           2           3            4           5
                                                                 方差膨胀因子
                                                                     VIF
                                            图 5    环境变量的方差膨胀因子        (VIF≤5)
              T 0 、T 50  及 T 300  分别表示 0、50 及 300 m 水温,Chl.a 0 、Chl.a 50 、Chl.a 100  及 Chl.a 300  分别表示 0、50、100  及 300 m 叶绿素浓度,DO 50 、
              DO 150  分别表示 50 及 150 m 溶解氧含量,S 300 . 300 m 盐度,SSH. 海表面高度,MLD. 混合层深度。下同。
                               Fig. 5 Variance inflation factor values of environmental variables (VIF≤5)
              T 0 , T 50  and T 300  represent the water temperatures at 0, 50, and 300 m, respectively. Chl.a 0 , Chl.a 50 , Chl.a 100  and Chl.a 300  represent the chlorophyll con-
              centrations at 0, 50, 100, and 300 m, respectively. DO 50  and DO 150  represent the dissolved oxygen at 50 m and 150 m, respectively. S 300 . the salinity at
              300 m. SSH. the sea surface height. MLD. the mixed layer depth. The same below.

              https://www.china-fishery.cn                           中国水产学会主办    sponsored by China Society of Fisheries
                                                            4
   63   64   65   66   67   68   69   70   71   72   73