
Page 117 - 《水产学报》2025年第8期
P. 117
林悦彤,等 水产学报, 2025, 49(8): 089310
Tab. 2 List of private alleles detected at the 10 microsatellite loci in each population
loci
population
MC08 MC18 MC44 MC47 MC54 MC57 MC66 MC74 MC76 MC99
SS 175 228 173 - 236 289 234 286 285 392
229 178 246 287 290
244 304
256
JJ - 237 - 292 223 284 247 297 270 -
238 299 227 293 248 280
241
FD 224 224 - 297 250 299 - 281 283 400
305 301 287
Notes: “-” indicates the absence of private alleles at the locus, the same below.
Tab. 3 Chi-square test of allele frequencies in 10 microsatellite loci and byssus phenotype
loci
phenotype
MC08 MC18 MC44 MC47 MC54 MC57 MC66 MC74 MC76 MC99
byssus secretion number 0.685 0.002 * 0.556 0.027 * 0.061 0.001 * 0.178 0.204 0.645 0.107
byssal thread diameter 0.750 0.186 0.036 * 0.008 * 0.704 0.006 * 0.299 0.318 0.572 0.480
byssal breaking force 0.811 0.022 * 0.041 * 0.071 0.529 0.017 * 0.028 * 0.011 * 0.124 0.235
plaque adhesion strength 0.857 0.409 0.527 0.115 0.257 0.002 * 0.224 0.165 0.330 0.275
Notes: “*” indicated at P<0.05, the same below. Bold font indicates significant differences between allele frequencies and byssus phenotype.
Tab. 4 AMOVA of three wild populations based on 10 microsatellite loci
source of variance df variance components percentage of variation F-statistic
among populations 2 0.122 14 5.18 F ST =0.051 76 *
among individuals / within population 165 0.309 04 13.10 F is =0.138 11 *
within individuals 168 1.928 57 81.73 F IT =0.182 72 *
pairwise F values indicated low genetic differenti- force were among the three populations, with the
ST
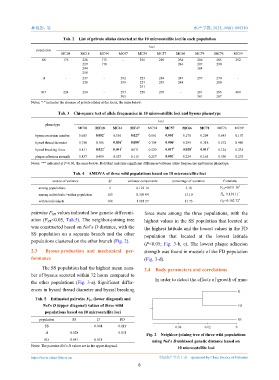
ation (F <0.05, Tab.5). The neighbor-joining tree
ST highest values in the SS population that located at
was constructed based on Nei’s D distance, with the the highest latitude and the lowest values in the FD
SS population on a separate branch and the other
population that located at the lowest latitude
populations clustered on the other branch (Fig. 2).
(P<0.05; Fig. 3-b, c). The lowest plaque adhesion
2.3 Byssus production and mechanical per- strength was found in mussels of the FD population
formance (Fig. 3-d).
The SS population had the highest mean num-
2.4 Body parameters and correlations
ber of byssus secreted within 72 hours compared to
In order to detect the effects of growth of mus-
the other populations (Fig. 3-a). Significant differ-
ences in byssal thread diameter and byssal breaking
JJ
Tab. 5 Estimated pairwise F ST (lower diagonal) and
Nei’s D (upper diagonal) values of three wild FD
populations based on 10 microsatellite loci
population SS JJ FD SS
SS 0.084 0.119
0.04 0.02 0
JJ 0.028 0.031
Fig. 2 Neighbor-joining tree of three wild populations
FD 0.041 0.018
using Nei’s D unbiased genetic distance based on
Notes: The pairwise Nei’s D values are in the upper diagonal.
10 microsatellite loci
https://www.china-fishery.cn 中国水产学会主办 sponsored by China Society of Fisheries
6