
Page 116 - 《水产学报》2025年第8期
P. 116
林悦彤,等 水产学报, 2025, 49(8): 089310
allele frequencies of 10 loci and the byssus pheno- 2.2 Genetic differentiation and population
type are shown in Tab. 3. The results indicated sig- structure
nificant associations between the allele frequencies
AMOVA revealed that the variation in three
of 3 loci (MC18, MC47, and MC57) and byssus
populations was mainly observed within individu-
secretion number (P<0.05), and between the allele
als (81.73%) (Tab. 4). The global F value (0.052)
ST
frequencies of 3 loci (MC44, MC47, and MC57) of the wild population suggested that there was
and byssal thread diameter (P<0.05). The allele fre- genetic differentiation among the three populations
quencies of 5 loci (MC18, MC44, MC57, MC66, (P<0.01; Tab.4). The values of pairwise F (0.018-
ST
and MC74) were associated with breaking force 0.041) and Nei’s D (0.031-0.119) increased with
(P<0.05), while the allele frequencies at the MC57 geographical distance, with the highest pairwise F ST
locus were associated with plaque adhesion strength (0.041) and Nei’s D (0.119) observed in the com-
(P<0.05). parison between the SS and FD populations. The
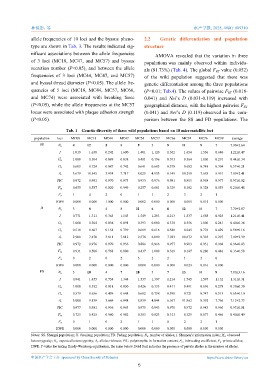
Tab. 1 Genetic diversity of three wild populations based on 10 microsatellite loci
population loci MC08 MC18 MC44 MC47 MC54 MC57 MC66 MC74 MC76 MC99 average
SS N a 4 12 5 8 9 5 9 11 9 7 7.90±2.64
I 1.019 1.658 0.242 1.600 1.401 1.120 1.302 1.654 1.556 0.686 1.22±0.47
H o 1.000 0.304 0.089 0.038 0.481 0.196 0.393 0.564 1.000 0.291 0.44±0.34
H e 0.603 0.724 0.087 0.742 0.641 0.605 0.578 0.682 0.748 0.304 0.57±0.21
A r 3.679 10.545 3.934 7.717 8.025 4.933 8.145 10.250 7.683 5.951 7.09±2.41
PIC 0.972 0.981 0.970 0.973 0.933 0.976 0.981 0.985 0.958 0.977 0.97±0.02
F is −0.655 0.587 −0.020 0.949 0.257 0.681 0.329 0.182 −0.328 0.053 0.20±0.48
P a 1 4 2 0 1 1 2 3 2 1
HWE 0.000 0.000 1.000 0.000 0.002 0.000 0.000 0.005 0.015 0.000
JJ N a 3 8 4 8 11 6 8 12 10 7 7.70±2.87
I 0.771 1.311 0.365 1.543 1.549 1.203 1.213 1.537 1.658 0.925 1.21±0.41
H o 1.000 0.304 0.036 0.091 0.393 0.000 0.370 0.556 1.000 0.241 0.40±0.36
H e 0.518 0.607 0.154 0.739 0.689 0.616 0.580 0.645 0.776 0.429 0.58±0.18
A r 2.906 7.470 3.811 7.812 9.578 6.000 7.023 10.672 8.383 6.297 7.00±2.39
PIC 0.972 0.976 0.970 0.956 0.886 0.966 0.977 0.983 0.951 0.968 0.96±0.03
F is −0.931 0.506 0.768 0.880 0.437 1.000 0.369 0.147 −0.280 0.446 0.33±0.58
P a 0 2 0 2 3 2 2 1 2 0
HWE 0.000 0.000 0.000 0.000 0.000 0.000 0.000 0.023 0.016 0.000
FD N a 3 10 4 7 10 5 7 13 10 9 7.80±3.16
I 0.941 1.455 0.754 1.344 1.537 1.397 1.214 1.745 1.597 1.132 1.31±0.31
H o 1.000 0.382 0.018 0.050 0.426 0.133 0.411 0.491 0.696 0.278 0.39±0.30
H e 0.579 0.656 0.439 0.648 0.682 0.738 0.590 0.721 0.747 0.513 0.63±0.10
A r 3.000 9.139 3.669 6.948 8.939 4.844 6.567 11.962 8.392 7.766 7.12±2.73
PIC 0.977 0.981 0.956 0.963 0.975 0.943 0.970 0.972 0.983 0.960 0.97±0.01
F is −0.723 0.425 0.960 0.962 0.383 0.823 0.313 0.329 0.077 0.466 0.40±0.49
P a 0 1 0 2 1 1 0 2 2 1
HWE 0.000 0.000 0.000 0.000 0.000 0.000 0.000 0.000 0.000 0.000
Notes: SS. Shengsi population; JJ. Jiaojiang population; FD. Fuding population. N a . number of alleles; I. Shannon’s information index; H o . observed
heterozygosity; H e . expected heterozygosity; A r . alleles richness; PIC. polymorphic in formation content; F is . inbreeding coefficient; P a . private alleles;
HWE. P-value for testing Hardy-Weinberg equilibrium, the same below. Bold font indicates the presence of private alleles in the number of alleles.
中国水产学会主办 sponsored by China Society of Fisheries https://www.china-fishery.cn
5