Page 86 - 《水产学报》2025年第5期
P. 86

张子硕,等                                                                 水产学报, 2025, 49(5): 059308


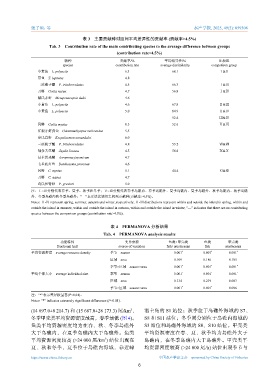
                                    表 3    主要贡献种对组间平均差异性的贡献率             (贡献率>4.5%)
                      Tab. 3    Contribution rate of the main contributing species to the average difference between groups
                                                   (contribution rate>4.5%)
                             物种                     贡献率/%              平均相异性/%                比较组
                            species               contribution rate  average dissimilarity  comparison group
                 小黄鱼 L. polyactis                     6.3                 68.1                 Ⅰ&Ⅱ
                 带鱼 T. lepturus                       4.8
                 三疣梭子蟹 P. trituberculatus             4.5                 66.3                 Ⅰ&Ⅲ
                 刀鲚 Coilia nasua                      4.7                 56.8                 Ⅰ&Ⅳ
                 戴氏赤虾 Metapenaeopsis dalei            4.6
                 小黄鱼 L. polyactis                     4.6                 67.8                 Ⅱ&Ⅲ
                 小黄鱼 L. polyactis                     5.0                 64.9                 Ⅱ&Ⅳ
                 —                                     —                  52.4                 Ⅲ&Ⅳ
                 凤鲚 Coilia mystus                     8.5                 52.6                 Ⅴ&Ⅵ
                 红狼牙虾虎鱼 Odontamblyopus rubicundus     5.5
                 安氏白虾 Exopalaemon annandalei          6.0
                 三疣梭子蟹 P. trituberculatus             4.8                 53.2                 Ⅶ&Ⅷ
                 细条天竺鲷 Jaydia lineata                 4.5                 56.6                 Ⅸ&Ⅹ
                 日本发光鲷 Acropoma japonicum             4.7
                 七星底灯鱼 Benthosema pterotum            4.6
                 凤鲚 C. mystus                         5.1                 44.4                 Ⅺ&Ⅻ
                 刀鲚 C. nasua                          4.7
                 葛氏长臂虾 P. gravieri                    5.0
              注:Ⅰ~Ⅳ分别代表春季、夏季、秋季和冬季;Ⅴ~Ⅻ分别代表春季岛礁内、春季岛礁外、夏季岛礁内、夏季岛礁外、秋季岛礁内、秋季岛礁
              外、冬季岛礁内和冬季岛礁外;“—”表示该比较组之间无贡献种(贡献率>4.5%)。
              Notes: Ⅰ-Ⅳ represent spring, summer, autumn and winter, respectively; Ⅴ-Ⅻ distributions represent within and outside the island in spring, within and
              outside the island in summer, within and outside the island in autumn, within and outside the island in winter; "—" indicates that there are no contributing
              species between the comparison groups (contribution rate>4.5%).


                                                表 4    PERMANOVA  分析结果
                                             Tab. 4    PERMANOVA analysis results
                           功能特性                       变异来源               鱼类+甲壳类         鱼类        甲壳类
                         functional trait           source of variation  fish+crustaceans  fish  crustaceans
              平均资源密度 average resource density   季节 season                  0.001 *      0.001 *    0.001 *
                                                区域 area                    0.109        0.186      0.105
                                                季节×区域 season×area          0.001 *      0.001 *    0.001 *
              平均个体大小 average individual size    季节 season                  0.001 *      0.001 *    0.001 *
                                                区域 area                    0.134        0.219      0.087
                                                季节×区域 season×area          0.001 *      0.001 *    0.006
              注:“*”表示差异极显著(P<0.01)。
              Notes: "*" indicates extremely significant differences (P<0.01).
              (14 697.0±8 214.7) 和  (15 687.0±28 173.3) 尾/km ,  泗主岛的    S1  站位;秋季位于岛礁外海域的              S7、
                                                         2
              冬季甲壳类平均资源密度最高,春季最低                    (图  4)。    S8  和  S11  站位;冬季则分别位于岛礁内海域的
              鱼类平均资源密度均为在春、秋、冬季岛礁外                             S3  站位和岛礁外海域的         S8、S10   站位。甲壳类
              大于岛礁内,在夏季岛礁内大于岛礁外。鱼类                             平均资源密度在春、夏、秋季均为岛礁外大于
              平均资源密度较高          (>24 000  尾/km ) 站位出现在         岛礁内,在冬季岛礁内大于岛礁外。甲壳类平
                                              2
              夏、秋和冬季,夏季位于岛礁内海域,靠近嵊                             均资源密度较高        (>24 000  尾/h) 站位出现季节与

              https://www.china-fishery.cn                           中国水产学会主办    sponsored by China Society of Fisheries
                                                            6
   81   82   83   84   85   86   87   88   89   90   91