Page 89 - 摩擦学学报2025年第8期
P. 89

第 8 期                           王大刚, 等: 钢丝绳摩擦损伤定量识别研究                                       1187


                                               表 8    损伤钢丝绳机器学习数据库
                                      Table 8    Machine learning database of damaged wire rope
                                                       Neural network input data
                Serial number                                                                         Loss
                                F 1       F 2       F 3       F 4        F 5       F 6       F 7
                    1          0.008     0.404     0.305      0.060     0.488     1.000     0.720     0.1%
                    2          0.000     0.121     0.185      0.433     0.481     0.688     0.110     0.2%
                    3          0.075     0.177     0.176      0.211     0.408     0.665     0.441     0.2%
                    4          0.443     0.478     0.096      0.106     0.402     0.444     0.331     0.2%
                    5          0.456     0.674     0.147      0.240     0.721     0.355     0.474     0.3%
                    6          0.415     0.499     0.800      0.067     0.366     0.506     0.202     0.3%
                    7          0.098     0.318     0.216      0.403     0.437     0.590     0.194     0.3%
                    8          0.336     0.609     0.055      0.067     0.357     0.385     0.643     0.3%
                    9          0.325     0.562     0.426      0.247     0.408     0.076     0.036     0.3%
                   10          0.048     0.193     0.118      0.295     0.734     0.470     0.221     0.4%
                   ···                                        ···                                      ···
                   270         0.778     0.357     0.204      0.565     0.126     0.354     0.863     8.0%
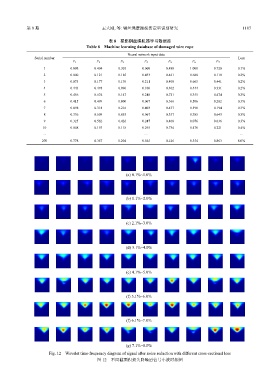


                                                       (a) 0.1%~1.0%


                                                       (b) 1.1%~2.0%


                                                       (c) 2.1%~3.0%


                                                       (d) 3.1%~4.0%


                                                       (e) 4.1%~5.0%


                                                       (f) 5.1%~6.0%


                                                       (f) 6.1%~7.0%


                                                       (g) 7.1%~8.0%
                      Fig. 12    Wavelet time-frequency diagram of signal after noise reduction with different cross-sectional loss
                                          图 12    不同截面积损失降噪后信号小波时频图
   84   85   86   87   88   89   90   91   92   93   94