
Page 115 - 《摩擦学学报》2021年第1期
P. 115
112 摩 擦 学 学 报 第 41 卷
CuRub: 1.000
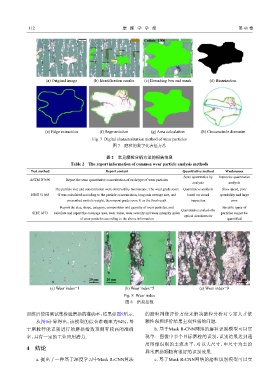
(a) Original image (b) ldentification results (c) Bounding box and mask (d) Binarization
(e) Edge extraction (f) Segmentation (g) Area calculation (h) Circumcircle diameter
Fig. 7 Digital characterization method of wear particles
图 7 磨粒的数字化表征方法
表 2 常见磨粒分析方法的报告信息
Table 2 The report information of common wear particle analysis methods
Test method Report content Quantitative method Weaknesses
Semi quantitative by Imprecise quantitative
ASTM D7690 Report the semi quantitative concentration of each type of wear particles
analysts analysis
The particle size and concentration were observed by microscope. The wear grade score Quantitative analysis Slow speed, poor
NB/T 51 068 G was calculated according to the particle concentration, long axis average size, and based on visual operability and large
prescribed particle weight, then report grade score G as the final result inspection error
Report the size, shape, category, composition and quantity of wear particles, and Specific types of
Quantitative analysis by
SH/T 0573 calculate and report the coverage area, wear value, wear severity and wear intensity index particles cannot be
optical densitometer
of wear particles according to the above information quantified
20 μm 20 μm 20 μm
(a) Wear index=1 (b) Wear index=5 (c) Wear index=9
Fig. 8 Wear index
图 8 磨损指数
训练后使用测试集检验磨损的准确率,结果如图9所示. 的磨粒图像评价方法来解决磨粒分析对专家人才依
从图9计算得出,该模型的综合准确率为94%,基 赖性强和评价结果主观性强的问题.
于磨粒智能识别进行的磨损指数预测有较高的准确 b. 基于Mask R-CNN网络的磨粒识别模型可以实
率,具有一定的工业应用潜力. 现单一图像中多个目标磨粒的识别,识别结果达到通
用图像识别的主流水平,对以大尺寸、中尺寸为主的
4 结论
异常磨损颗粒有很好的识别效果.
a. 提出了一种基于深度学习中Mask R-CNN算法 c. 基于Mask R-CNN网络的磨粒识别模型可以实