


Page 146 - 《高原气象》2026年第5期
P. 146
高     原      气     象                                 45 卷
              1362
             说明湿空气沿MPV 梯度方向向山地迎风坡输送(殷                           显著的低空急流, 但在副高外围有以西南气流为主
                               1
             菲等, 2020), 地形抬升使湿空气沿等熵面倾斜上升                        的弱水汽输送通道[图 7(a)双虚线箭头所示]。

             (寿绍文, 2019), 增强垂直涡度拉伸(∂ω/∂z>0)(韩                   20:00 降水区 700 hPa 为一致的偏北水汽通量, 副热
             宁, 2012), 进一步降低 MPV 负值, 形成正反馈。                     带高压外围西南与偏东水汽通量分量均较弱。至
                                        1
             配合中层大气相对湿度饱和状态, 说明图 5(b)降水                         22:00[图 7(b)], 出现偏北水汽通量分量绕流转向,
             区中低层湿度增强机制为: 地形迎风坡与 500~700                        偏西水汽通量分量显著增强并与副高外围西南水
             hPa 涡旋中心的上升支叠加, 强的上升运动迫使近                          汽通量耦合形成中尺度气旋性环流, 该环流在动力
             地层湿空气抬升至 600 hPa 附近, 水汽通过凝结释                       旋转过程中, 与来自华北平原的东风水汽通量相
             放潜热加热中层大气(武麦凤等, 2025), 使饱和湿                        遇, 在暴雨区形成明显的水汽通量辐合(乔舒婷和
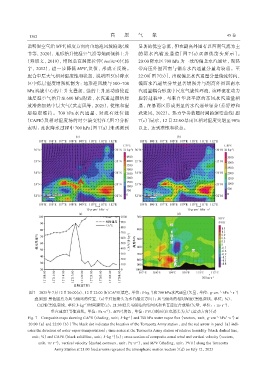
             层稳定维持。700 hPa 水汽通量、 对流有效位能                         武麦凤, 2022)。热力学参数随时间的演变曲线[图
             (CAPE)及相对湿度场的时空演变特征(图 7)分析                         7(c)]显示, 12日 22:00暴雨区相对湿度突增至 90%

             表明: 此次降水过程中 700 hPa[图 7(a)]未观测到                    以上, 达到准饱和状态。


                                                                                                         -1
                                                                     -1
                                                                                                    -1
                                                                                                           -1
              图7 2025年7月12日20:00(a)、 12日22:00 (b)CAPE(填色, 单位: J·kg )和700 hPa水汽通量(矢量, 单位: g·cm ·hPa ·s )
                 叠加图[黑色圆点为兵马俑站的位置, (a)中红色箭头为水汽输送方向]; 兵马俑站的相对湿度(黑色虚线, 单位: %)、
                                       -1
                  CAPE(黑色实线, 单位J·kg )时间演变(c); 21:00沿兵马俑站的纬向风和垂直速度合成场(矢量, 单位: : m·s )、
                                                                                                      -1
                                                 -1
                        垂直速度(等值虚线, 单位: Pa·s )、 MPV(填色, 单位: PVU)剖面(红色箭头为大气运动方向)(d)
              Fig. 7 Composite maps showing CAPE (shading, unit: J·kg⁻¹) and 700 hPa water vapor flux (vectors, unit: g·cm ·hPa ·s ) at
                                                                                                       -1
                                                                                                   -1
                                                                                                          -1
              20:00 (a) and 22:00 (b) [The black dot indicates the location of the Terracotta Army station, and the red arrow in panel (a) indi‐
              cates the direction of water vapor transportation]; time series at the Terracotta Army station of relative humidity (black dashed line,
               unit: %) and CAPE (black solid line, unit: J·kg⁻¹)(c); cross section of composite zonal wind and vertical velocity (vectors,
                  unit: m·s⁻¹), vertical velocity (dashed contours, unit: Pa·s⁻¹), and MPV (shading, unit: PVU) along the Terracotta
                          Army Station at 21:00 (red arrows represent the atmospheric motion vectors )(d) on July 12, 2025

