


Page 91 - 《高原气象》2026年第4期
P. 91
4 期               肖  丹等:四川盆地2023年7月11 -13日一次持续性大暴雨的物理机制分析                                  1021


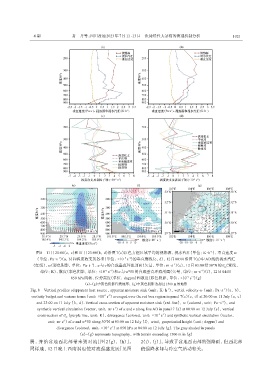
                 图8 11日20:00(a, c)和11日23:00(b, d)沿图7(c)红色方框区域平均的视热源、 视水汽汇(单位: K·h )、 垂直速度ω
                                                                                                -1
                                                         -9
                           -1
                                                           -2
                 (单位: Pa·s )(a, b)和涡度收支及各项(单位: ×10  s )的垂直廓线(c, d), 12日00:00沿图7(a)中AB线的视水汽汇
                                                                               -1
                                          -1
                (红线)、 ω (彩色阴影, 单位: Pa·s )、 u与v的合成垂直环流剖面(矢量, 单位: m·s )(e), 12日03:00沿30°N的θ se (紫线,
                                                   -1
                   单位: K)、 散度(彩色阴影, 单位: ×10  s )和u与w*50的合成垂直环流剖面(矢量, 单位: m·s )(f), 12日04:00
                                                 -5
                                                                                            -1
                                 850 hPa风场、 位势高度(单位: dagpm)和散度(彩色阴影, 单位: ×10  s )(g)
                                                                                        -1
                                                                                      -5
                                       (e)~(g)中灰色阴影代表地形; (g)中灰色阴影为超过1500 m的地形
                                                                             -1
                                                                                                      -1
               Fig. 8 Vertical profiles ofapparent heat source, apparent moisture sink (unit: K·h ), verticl velocity ω (unit: Pa·s )(a, b),
                                                  -2
               vorticity budget and various terms (unit: ×10  s ) averaged over the red box region in panel 7(c)(c, d) at 20:00 on 11 July (a, c)
                                                -9
                                                                                                      -1
                  and 23:00 on 11 July (b, d). Vertical cross-section of apparent moisture sink (red line), ω (colored, unit: Pa·s ), and
                                                     -1
                  synthetic vertical circulation (vector, unit: m·s ) of u and v along line AB in panel 7 (a) at 00:00 on 12 July (e), vertical
                                                                           -1
                  cross-section of θ se  (purple line, unit: K), divergence (colored, unit: ×10  s ) and synthetic vertical circulation (vector,
                                                                         -5
                       unit: m·s ) of u and w*50 along 30°N at 03:00 on 12 July (f), wind, geopotential height (unit: dagpm) and
                              -1
                                                    -1
                                                  -5
                           divergence (colored, unit: ×10  s ) at 850 hPa at 04:00 on 12 July (g). The gray shaded in panels
                                     (e)~(g) represents topography, with terrain exceeding 1500 m in (g)
               展, 并给盆地西北部带来强对流[图 2(g), (h)]。                     2(i), (j)], 导致了盆地西南部的强降雨, 但西北部
               同样地, 12 日晚上西南涡也使对流强盛发展[见图                         的强降水却与冷空气活动有关。

