


Page 89 - 《高原气象》2026年第4期
P. 89
4 期               肖  丹等:四川盆地2023年7月11 -13日一次持续性大暴雨的物理机制分析                                  1019


                                                                                       -1
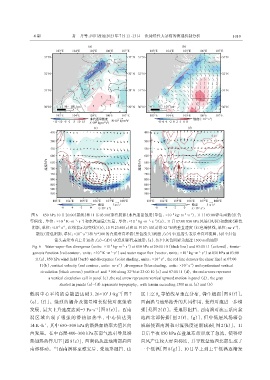
               图6  850 hPa 10日20:00(黑线)和11日03:00(彩色阴影)水汽通量散度(单位: ×10  kg·m ·s ), 11日03:00锋生函数(红色
                                                                                    -2
                                                                               -8
                                   -1
                             -9
                                                                    -1
                                                                       -1
                                     -1
                                                              -3
               等值线, 单位: ×10  K·m ·s )和水汽通量(矢量, 单位:×10  kg·m ·s )(a), 11 日 07:00 850 hPa 风场(风羽)和散度(彩色
                                                                                                           -1
                              -1
                           -5
                阴影,单位:×10  s , 红线表示切变线)(b),10日23:00(c)和11日07:00(d)沿32 °N的垂直速度 (红色等值线,单位:m·s )、
                                     -5
                                        -1
                 散度(蓝色阴影,单位:×10  s )和与*100的合成垂直环流(黑色箭头)剖面,(c)中红色箭头表示垂直环流圈,(d)中红色
                          箭头表示垂直上升运动;(a)~(d)中灰色阴影代表地形;(a)、(b)中灰色阴影为超过1500 m的地形
                                                   -8
                                                        -2
               Fig. 6 Water vapor flux divergence (units: ×10  kg·m ·s ) at 850 hPa at 20:00 10 (black line) and 03:00 11 (colored), fronto‐
                                                           -1
                genesis function (red contour, units: ×10  K·m ·s ) and water vapor flux (vector, units: ×10  kg·m ·s ) at 850 hPa at 03:00
                                              -9
                                                                                     -3
                                                     -1
                                                                                             -1
                                                   -1
                                                                                           -1
                                                                           -1
                                                                         -5
                 11(a),850 hPa wind field (barb) and divergence (color shading, units: ×10  s , the red line denotes the shear line) at 07:00
                                                       -1
                    11(b),vertical velocity (red contour, units: m·s ) ,divergence (blue shading, units: ×10  s ) and synthesized vertical
                                                                                       -1
                                                                                     -5
                   circulation (black arrows) profile of  and  *100 along 32°N at 23:00 10 (c) and 07:00 11 (d), the red arrows represent
                       a vertical circulation cell in panel (c),the red arrow represents vertical upward motion in panel (d), the gray
                            shaded in panels (a)~(d) represents topography, with terrain exceeding 1500 m in (a) and (b)
               低涡中心平均的总能量达到 3. 26×10  J·kg [图 7                  区上空 θ se 等值线呈垂直分布, 锋生极强[图 8(f)]。
                                                 5
                                                       -1
              (e), (f)]。强烈的辐合及能量增长促使对流强盛                         西南涡与地形抬升的共同作用, 使得对流进一步增
                                            -1
               发展, 最大上升速度达到-3 Pa·s [图 8(e)]。西南                   强[见图 2(f)]。受地形阻挡, 西南涡对流云系向盆
               涡区域出现了很强的潜热加热率, 中心值达到                             地西北部传播[图 2(f), (g)], 但中低层风场辐合
                     -1
               14 K·h , 其中 650~500 hPa的潜热加热率大值区向                 减弱使西南涡和对流强度逐渐减弱[图 2(h)]。11
               西发展。在中高层 400~300 hPa 东南气流引导及潜                     日后半夜 850 hPa 在盆地东部形成了急流, 使得经
               热加热的作用下[图 8(e)], 西南涡从盆地南部向西                       向风产生较大经向梯度, 并导致盆地西北部生成了
               南部移动。当西南涡移至雅安后, 受地形阻挡, 山                          一个低涡[图 8(g)], 10 日早上到上午低涡逐渐发

