


Page 90 - 《高原气象》2026年第4期
P. 90
高     原      气     象                                 45 卷
              1020


                                                                                                            -1
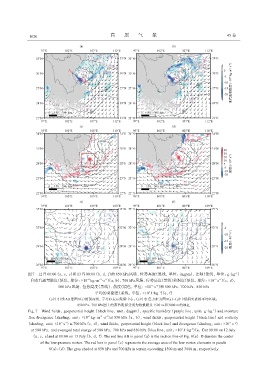
              图7 12日00:00 (a, c, e)和13日00:00 (b, d, f)的850 hPa风场、 位势高度(黑线, 单位: dagpm)、 比湿(紫线, 单位: g·kg )
                                              -2
                                         -8
                                                                                                  -5
                                                 -1
                                                                                                    -1
               和水汽通量散度(填色, 单位: ×10  kg·m ·s )(a, b), 700 hPa风场、 位势高度(黑线)和涡度(填色, 单位: ×10  s )(c, d),
                                                                      -5
                           500 hPa风场、 位势高度(黑线)、 散度(填色, 单位: ×10  s )和500 hPa、 700 hPa、 850 hPa
                                                                        -1
                                                                         -1
                                                                    5
                                            平均的总能量(蓝线, 单位: ×10  J·kg )(e, f)
                       (a)中红线AB是图8(e)的剖面线, 字母D表示低涡中心; (c)中红色方框为图8(a)~(d)中低涡要素的平均区域;
                                    850 hPa、 700 hPa图上的灰色阴影分别为海拔超过1500 m和3000 m的地区
              Fig. 7 Wind fields, geopotential height (black line, unit: dagpm), specific humidity (purple line, unit: g·kg ) and moisture
                                                                                                 -1
                                                 -1
              flux divergence (shading, unit: ×10  kg·m ·s )at 850 hPa (a, b), wind fields, geopotential height (black line) and vorticity
                                         -8
                                              -2
                                                                                                         -5
                               -1
                             -5
             (shading, unit: ×10  s ) at 700 hPa (c, d), wind fields, geopotential height (black line) and divergence (shading, unit: ×10  s⁻¹)
               at 500 hPa, and averaged total energy of 500 hPa, 700 hPa and 850 hPa (blue line, unit: ×10  J·kg )(e, f)at 00:00 on 12 July
                                                                                   5
                                                                                        -1
                (a, c, e)and at 00:00 on 13 July (b, d, f). The red line AB in panel (a) is the section line of Fig. 8(e). D denotes the center
                   of the low-pressure vortex. The red box in panel (c) represents the average area of the low vortex elements in panels
                       8(a)~(d). The gray shaded at 850 hPa and 700 hPa is terrain exceeding 1500 m and 3000 m, respectively

