


Page 104 - 《高原气象》2026年第3期
P. 104
高     原      气     象                                 45 卷
              712


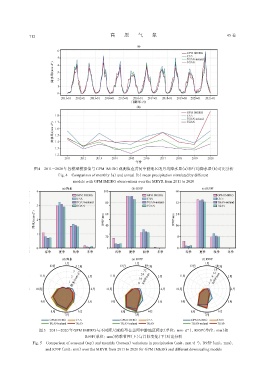
                图4 2011 -2020年各模型模拟值与GPM IMERG观测值在黄河中游地区的月均降水量(a)和年均降水量(b)对比分析
                            Fig. 4 Comparison of monthly (a) and annual (b) mean precipitation simulated by different
                                  models with GPM IMERG observations over the MRYR from 2011 to 2020


                   图5 2011 -2020年GPM IMERG与不同降尺度模型在黄河中游地区降水(单位: mm·d⁻¹)、 R95P(单位: mm)和
                                        R99P(单位: mm)的季节性(上)与月际变化(下)对比分析
                Fig. 5 Comparison of seasonal (top) and monthly (bottom) variations in precipitation (unit: mm·d⁻¹), R95P (unit: mm),
                      and R99P (unit: mm) over the MRYR from 2011 to 2020 for GPM IMERG and different downscaling models

