


Page 101 - 《高原气象》2026年第3期
P. 101
3 期                       王彩玲等:基于地形引导注意力的降水降尺度模型研究                                         709
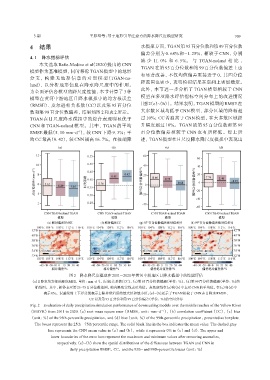
               4  结果                                             水模拟方面, TGAN第95百分位数和第99百分位数
                                                                 偏差分别为 0. 68% 和-1. 25%, 相较于 CNN, 分别
               4. 1 降水指标评估
                                                                 减 少 11. 0% 和 6. 5%。 与 TGAN-noland 相 比 ,
                   本文选取 Baño-Medina et al(2020)提出的 CNN
                                                                 TGAN 在第 95 百分位数和第 99 百分位数偏差上也
               模型作为基准模型, 同时移除 TGAN 模型中的地形
                                                                 有显著改善, 不仅均值偏差更接近于 0, 其四分位
               分 支 ,  构 建 无 地 形 信 息 的 对 照 模 型(TGAN-no‐
                                                                 距范围也更小, 表明模拟结果在空间上更加稳定。
               land), 以分析地形信息在降水降尺度中的作用。
                                                                 此外, 本节进一步分析了 TGAN 模型相较于 CNN
               为全面评估各模型的降尺度性能, 本节计算了 3 种
                                                                 模型在多项降水评估指标空间分布上的改进情况
               模型在黄河中游地区日降水模拟中的均方根误差
              (RMSE)、 皮尔逊相关系数(CC)以及第 95 百分位                     [图 2(e)~(h)]。结果表明, TGAN 模型的 RMSE 在
               数和第 99 百分位数偏差, 结果如图 2 和表 2 所示。                    大多数区域均低于 CNN 模型, 部分区域的降幅超
               TGAN 在日尺度降水模拟中的综合表现明显优于                           过 10%; CC 普遍高于 CNN 模型, 在大多数区域提
               CNN 和 TGAN-noland 模型。其中, TGAN 的平均                 升幅度超过 10%。TGAN 的第 95 百分位数和第 99
               RMSE 最低(5. 10 mm·d ), 较 CNN 下降 9. 3%; 平           百分位数偏差相较于 CNN 也有所降低。综上所
                                    -1
               均 CC 最高(0. 42), 较 CNN 提高 16. 7%。在极端降              述, TGAN 模型在日尺度降水降尺度模拟中表现出


                                 图2 降水降尺度模型在2011 -2020年黄河中游地区日降水模拟中的性能评估
               (a)日降水均方根误差(RMSE, 单位: mm·d⁻¹)、 (b)相关系数(CC)、 (c)第95百分位数偏差(单位: %)、 (d)第99百分位数偏差(单位: %)的
                 箱线图。其中, 箱体表示第25~75百分位数范围, 箱内黑色实线表示均值。灰色虚线在(a)和(b)中表示CNN的平均值, 在(c)和(d)中
                     表示0%。误差线的上下界分别表示去除异常值后的最大值和最小值。(e)~(h)展示了TGAN相较于CNN在日降水RMSE、
                                          CC以及第95百分位和第99百分位偏差(单位: %)的空间分布
               Fig. 2 Evaluation of daily precipitation simulation performance of downscaling models over the middle reaches of the Yellow River
               (MRYR) from 2011 to 2020.(a) root mean square error (RMSE, unit: mm·d⁻¹), (b) correlation coefficient (CC), (c) bias
               (unit: %) of the 95th-percentile precipitation, and (d) bias (unit: %) of the 99th-percentile precipitation, presented as boxplots.
                 The boxes represent the 25th–75th percentile range. The solid black line in the box indicates the mean value. The dashed gray
                       line represents the CNN mean value in (a) and (b), while it represents 0% in (c) and (d). The upper and
                        lower boundaries of the error bars represent the maximum and minimum values after removing anomalies,
                           respectively.(e)~(h) show the spatial distributions of the differences between TGAN and CNN in
                                 daily precipitation RMSE, CC, and the 95th- and 99th-percentile biases (unit: %)

