
Page 50 - 《高原气象》2026年第2期
P. 50
高 原 气 象 45 卷
350
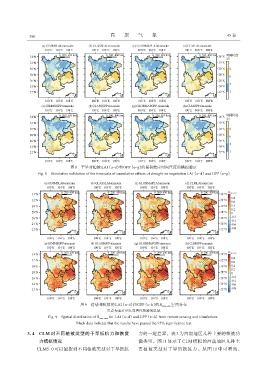
图8 干旱对植被LAI (a~d)和GPP (e~g)的累积效应时间尺度的模拟验证
Fig. 8 Simulation validation of the timescale of cumulative effects of drought on vegetation LAI (a~d) and GPP (e~g)
图9 遥感和模拟的LAI (a~d)和GPP (e~h)的R max-cum 空间分布
黑点为通过95%显著性检验的区域
Fig. 9 Spatial distribution of R max-cum for LAI (a~d) and GPP (e~h) from remote sensing and simulations.
Black dots indicate that the results have passed the 95% significance test
3. 4 CLM 对不同植被类型的干旱抵抗力和恢复 力的一定差异。表 3为西南地区几种主要的植被功
力模拟情况 能类型。图 11 显示了 CLM 模拟的西南地区几种主
CLM5. 0可以捕捉到不同植被类型对干旱抵抗 要植被类型对干旱的抵抗力。从图 11 中可看出,