Page 280 - 《高原气象》2026年第2期
P. 280

高     原      气     象                                 45 卷
              580


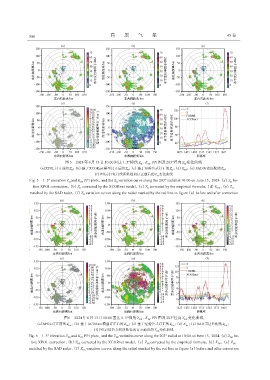
                               图5 2024年6月13日10:00雷达1. 5°仰角Z 、 K  PPI图及203°径向Z 变化曲线
                                                                    DP
                                                                 H
                                                                                     H
                   (a)XPOL订正前的Z ; (b) 基于XCORnet模型订正后的Z ; (c) 基于经验公式订正的Z ; (d) K ; (e) SAD雷达匹配的Z ;
                                                                                                      H
                                 H
                                                                                     DP
                                                           H
                                                                               H
                                           (f) 图(a)红色直线所处径向订正前后的Z 变化曲线
                                                                        H
              Fig. 5 1. 5° elevation Z and K  PPI plots, and the Z variation curve along the 203° radial at 10:00 on June 13, 2024.(a) Z  be‐
                                     DP
                                H
                                                                                                          H
                                                      H
                fore XPOL correction, (b) Z  corrected by the XCORnet model, (c) Z corrected by the empirical formula, (d) K , (e) Z
                                                                                                    DP
                                                                    H
                                     H
                                                                                                          H
              matched by the SAD radar, (f) Z variation curves along the radial marked by the red line in figure (a) before and after correction
                                       H


                              图6 2024年6月13日10:00雷达1. 5°仰角Z 、 K  PPI图及203°径向Z 变化曲线
                                                                                     DR
                                                                    DP
                                                                DR
                 (a)XPOL订正前的Z ; (b) 基于XCORnet模型订正后的Z ; (c) 基于经验公式订正的Z ; (d) K ; (e) SAD雷达匹配的Z ;
                                DR                        DR                   DR    DP                DR
                                           (f) 图(a)红色直线所处径向订正前后的Z 变化曲线
                                                                        DR
              Fig. 6 1. 5° elevation Z and K  PPI plots, and the Z variation curve along the 203° radial at 10:00 on June 13, 2024.(a) Z  be‐
                                                                                                         DR
                                      DP
                                DR
                                                      DR
               fore XPOL correction, (b) Z  corrected by the XCORnet model, (c) Z corrected by the empirical formula, (d) K , (e) Z
                                                                                                           DR
                                                                    DR
                                    DR
                                                                                                    DP
              matched by the SAD radar, (f) Z variation curves along the radial marked by the red line in figure (a) before and after correction
                                       DR
   275   276   277   278   279   280   281   282   283   284   285