
Page 253 - 《高原气象》2026年第1期
P. 253
1 期 黄武斌等:两次副高边缘型特大暴雨事件的降水极端性对比分析 249
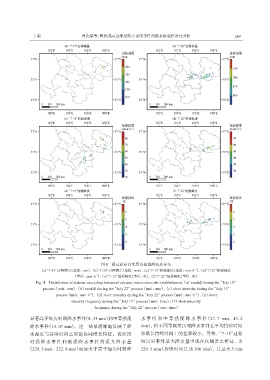
图4 超过建站以来历史极值的站点分布
-1
(a)“7·15”过程雨量(单位: mm), (b)“7·22”过程雨量(单位: mm), (c)“7·15”短强强度(单位: mm·h ), (d)“7·22”短强强度
-1
(单位: mm·h ), (e)“7·15”短强频次(单位: 次), (f)“7·22”短强频次(单位: 次)
Fig. 4 Distribution of stations exceeding historical extreme values since site establishment.(a) rainfall during the “July 15"
process (unit: mm), (b) rainfall during the “July 22” process (unit: mm), (c) short Intensity during the “July 15”
-1
-1
process (unit: mm·h ), (d) short Intensity during the “July 22” process (unit: mm·h ), (e) short
intensity frequency during the “July 15” process (unit: time), (f) short intensity
frequency during the “July 22” process (unit: time)
显著高于短历时弱降水事件(8. 33 mm)和中等强度 水 事 件 和 中 等 强 度 降 水 事 件(27. 7 mm、 43. 2
降水事件(13. 07 mm)。这一结果清晰地反映了降 mm), 但不同等级短历时降水事件在平均持续时间
水强度与持续时间之间的协同增长特征。而短历 和最长持续时间上的差异较小。另外, “7·15”过程
时 强 降 水 事 件 和 极 强 降 水 事 件 的 最 大 降 水 量 短历时事件最大降水量出现在庆城县土桥站, 为
(229. 5 mm、 222. 8 mm)远远大于高于短历时弱降 229. 5 mm(持续时间长达 300 min), 其最大 5 min