
Page 160 - 《高原气象》2026年第1期
P. 160
高 原 气 象 45 卷
156
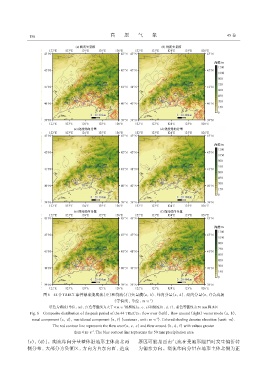
图6 44个TRECT事件鼎盛期爬流(左)和绕流(右)矢量模(a, b)、 纬向分量(c, d)、 经向分量(e, f)合成场
-1
(等值线, 单位: m·s )
-1
填色为海拔(单位: m), 红色等值线为大于4 m·s 的爬流(a、 c、 e)和绕流(b、 d、 f), 蓝色等值线为50 mm降水区
Fig. 6 Composite distribution of the peak period of the 44 TRECTs: flow over (left), flow around (right) vector mode (a, b),
-1
zonal component (c, d), meridional component (e, f) (contours, unit: m·s ). Colored shading denotes elevation (unit: m).
The red contour line represents the flow over(a, c, e) and flow around (b, d, f) with values greater
-1
than 4 m·s . The blue contour line represents the 50 mm precipitation area
(c), (d)]。爬流纬向分量整体沿地形主体南北两 原因可能是西南气流在受地形阻挡时发生偏折转
侧分布, 大部分为负值区, 方向为自东向西, 造成 为偏东方向。绕流纬向分量在地形主体北侧为正