
Page 69 - 《高原气象》2025年第6期
P. 69
6 期 张 璇等:基于SWAT+模型的黑河上游山区水文要素变化模拟与预测 1477
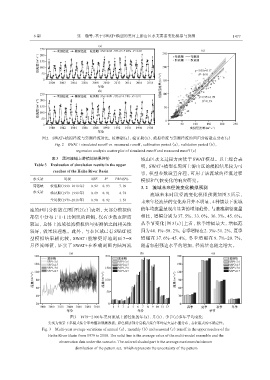
图2 SWAT+模拟径流与实测径流对比, 校准期(a)、 验证期(b)、 模拟径流与实测径流的回归分析散点分布(c)
Fig. 2 SWAT+ simulated runoff vs. measured runoff, calibration period (a), validation period (b),
regression analysis scatter plot of simulated runoff and measured runoff (c)
表3 黑河流域上游模拟结果评价 域山区水文过程方面优于 SWAT模型。以上综合表
Table 3 Evaluation of simulation results in the upper 明, SWAT+模型在黑河上游山区的模拟结果较为可
reaches of the Heihe River Basin
靠, 模型参数设置合理, 可用于该流域的径流过程
水文站 时段 NSE R 2 PBIAS/% 模拟和气候变化的响应研究。
莺落峡 校准期(1999-2018年) 0. 92 0. 93 -7. 09 3. 2 流域未来径流变化模拟预测
水文站 验证期(1979-1998年) 0. 89 0. 91 4. 74 流域未来时段径流变化模拟预测如图 3 所示,
全时段(1979-2018年) 0. 90 0. 92 1. 56 未来年径流量的变化差异并不明显, 4种情景下流域
流的回归分析散点图[图 2(c)]表明, 大部分模拟值 的年均流量呈现出显著的增加趋势, 与基准期径流量
都集中分布于 1∶1 比例线的两侧, 仅有少数点距离 相比, 增幅分别为 37. 5%、 33. 0%、 36. 3%、 45. 6%。
较远, 总体上流域径流模拟值与实测值之间相关性 从季节变化[图 3(c)]上看, 秋季增幅最大, 增幅范
较好, 效果较理想。此外, 与本区域已有 SWAT 模 围为44. 1%~58. 2%, 春季增幅在2. 3%~31. 2%, 夏季
型模拟结果相比较, SWAT+能够更好地刻画 7 -8 增幅在 37. 6%~45. 4%, 冬季增幅在 9. 7%~20. 7%,
月径流峰值, 证实了 SWAT+在准确刻画内陆河流 随着辐射强迫水平的增加, 径流量也随之增大。
图3 1979 -2100年黑河流域上游径流的年(a)、 月(b)、 季节(c)多年平均变化
实线为情景下多模式集合平均值和观测数据; 彩色阴影部分是模式集合平均最大最小值分布, 表征模式的不确定性。
Fig. 3 Multi-year average variations of annual (a), monthly (b) and seasonal (c) runoff in the upper reaches of the
Heihe River Basin from 1979 to 2100. The solid line is the average value of the multi-model ensemble and the
observation data under the scenario. The colored shaded part is the average maximum/minimum
distribution of the pattern set, which represents the uncertainty of the pattern