
Page 46 - 《高原气象》2025年第5期
P. 46
高 原 气 象 44 卷
1164
表3 高原多年冻土土壤冻融时间参量在不同气候区域的变化趋势
Table 3 Trends of soil freeze-thaw time parameters in different climatic regions of the plateau permafrost
-1
冻融参量变化趋势/[d·(10a) ] 多年冻土全域 干旱区 半干旱区 半湿润区
冻结开始时间 1. 7 ** 0. 77* 1. 8 ** 2. 4 **
冻结结束时间 -0. 5 0. 2 0. 01 -1. 8 **
冻结持续时间 -2. 2 ** -0. 5 -1. 8 ** -4. 2 **
融化持续时间 2 ** 0. 3 1. 6 * 4 **
*代表通过 90% 的信度检验, **代表通过 99% 的信度检验(*represents passing the 90% confidence level test, and **represents passing the
99% confidence level test)
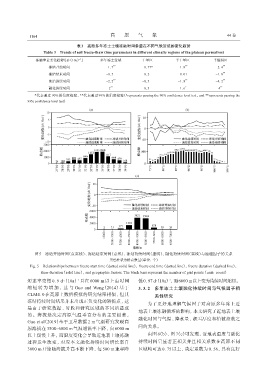
图5 冻结开始时间(点实线)、 冻结结束时间(点线)、 冻结持续时间(虚线)、 融化持续时间(实线)与地理因子的关系
黑色柱状为格点数量(单位: 个)
Fig. 5 Relationships between freeze start time (dotted solid line), freeze end time (dotted line), freeze duration (dashed line),
thaw duration (solid line), and geographic factors. The black bars represent the number of grid points (unit: count)
短速率变慢 0. 9 d·(10a) 且在 6000 m 以上由时间 低0. 97 d·(10a), 而6000 m以上变为持续时间缩短。
-1
-1
缩 短 转 为 增 加 , 这 与 Guo and Wang(2014)基 于 3. 3. 2 多年冻土土壤融化持续时间与气候因子相
CLM4. 0 在高原上数值模拟的研究结果相似, 但其 关性研究
冻结持续时间结果并未出现正负变化的转折点, 这
为了更好地理解气候因子对高原多年冻土近
是由于研究数据、 时段和研究区域的不同所造成
地表土壤冻融循环的影响, 本文研究了近地表土壤
的。海拔是决定高原气温垂直分布的主要因素,
融化时间与气温、 降水量、 积雪厚度和植被指数之
Guo et al(2019)基于卫星数据 2 m 气温研究发现高
间的关系。
原海拔在 3500~6000 m 气温增温率下降, 自 6000 m
以上缓慢上升, 而温度变化会导致近地表土壤冻融 由图 6(b)、 图 7(c)可发现, 近地表温度与融化
过程发生改变, 对应本文融化持续时间增长率自 持续时间呈显著正相关并且相关系数在高原不同
3000 m 开始随海拔升高不断下降, 每 500 m 速率降 区域均可达 0. 75以上, 决定系数为 0. 56, 具有良好