
Page 45 - 《高原气象》2025年第5期
P. 45
5 期 李博渊等:青藏高原多年冻土冻融参量时空变化特征及影响因子研究 1163
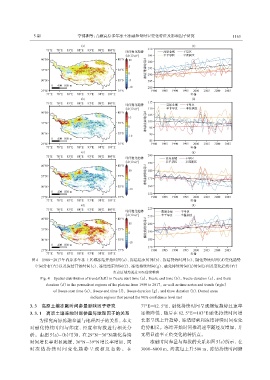
图4 1980 -2017年高原多年冻土区域冻结开始时间(a)、 冻结结束时间(b)、 冻结持续时间(c)、 融化持续时间(d)变化趋势
空间分布(左)以及冻结开始时间(e)、 冻结结束时间(f)、 冻结持续时间(g)、 融化持续时间(h)时间序列及变化趋势(右)
打点区域为通过90%信度检验
Fig. 4 Spatial distribution of trends(left) in freeze start time (a), freeze end time (b), freeze duration (c), and thaw
duration (d) in the permafrost regions of the plateau from 1980 to 2017, as well as time series and trends (right)
of freeze start time (e), freeze end time (f), freeze duration (g), and thaw duration (h). Dotted areas
indicate regions that passed the 90% confidence level test
3. 3 高原土壤冻融时间参量影响因子研究 77°E -82. 5°E, 融化持续时间呈现缩短趋势且速率
3. 3. 1 高原土壤冻融时间参量与地理因子的关系 逐渐降低, 随后在 82. 5°E -103°E 融化持续时间增
为探究高原冻融参量与地理因子的关系, 本文 长率呈现上升趋势, 冻结结束和冻结持续时间变化
对融化持续时间与纬度、 经度和海拔进行相关分 趋势相反。冻结开始时间推迟速率随经度增加, 并
析。由图 5(a)~(b)可知, 在 29°N -36°N 融化持续 无明显速率正负变化的转折点。
时间增长率明显减缓, 36°N -39°N 增长率增加, 同 冻融时间参量与海拔的关系如图 5(c)所示, 在
时 冻 结 持 续 时 间 变 化 趋 势 呈 现 相 反 态 势 。 在 3000~6000 m, 海拔每上升 500 m, 冻结持续时间缩