
Page 256 - 《高原气象》2025年第5期
P. 256
高 原 气 象 44 卷
1374
-1
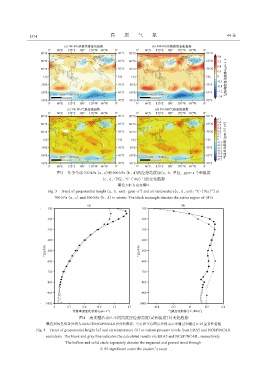
图3 冬季全球700 hPa (a, c)和500 hPa (b, d)的位势高度场(a, b, 单位: gpm·a )和温度
[c, d, 单位: ℃·(10a)]的变化趋势
-1
黑色方框为南支槽区
-1
-1
Fig. 3 Trend of geopotential height (a, b, unit: gpm·a ) and air temperature[c, d, unit: ℃·(10a)] at
700 hPa (a, c) and 500 hPa (b, d) in winter. The black rectangle denotes the active region of IBTs
图4 南支槽活动区不同高度层位势高度(a)和温度(b)变化趋势
黑色和灰色线条分别为ERA5和NCEP/NCAR再分析数据, 空心和实心圆点分别表示未通过和通过0. 05显著性检验
Fig. 4 Trend of geopotential height (a) and air temperature (b) at variant pressure levels from ERA5 and NCEP/NCAR
reanalysis. The black and grey line indicates the calculated results via ERA5 and NCEP/NCAR, respectively.
The hollow and solid circle separately denotes the unpassed and passed trend through
0. 05 significant under the student’s t-test