
Page 260 - 《高原气象》2025年第5期
P. 260
高 原 气 象 44 卷
1378
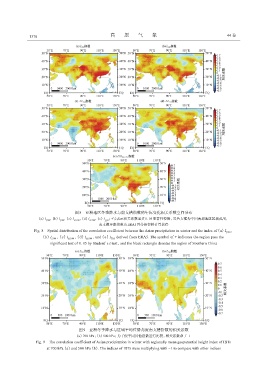
图8 亚洲地区冬季降水与南支槽指数的年际变化相关系数空间分布
(a) I ζ700 , (b) I ζ500 , (c) I ∆Z700 , (d) I ∆Z700 , (e) I ∏Ω ; +号表示相关系数通过0. 05显著性检验, 黑色方框为中国南部地区区域范围,
南支槽环流指数由ERA5再分析资料计算获得
Fig. 8 Spatial distribution of the correlation coefficient between the Asian precipitation in winter and the index of (a) I ζ700 ,
(b) I ζ500 , (c) I ∆Z700 , (d) I ∆Z700 , and (e) I ∏Ω derived from ERA5. The symbol of + indicates the region pass the
significant test of 0. 05 by Student’s t-test, and the black rectangle denotes the region of Southern China
图9 亚洲冬季降水与区域平均位势高度南支槽指数的相关系数
(a) 700 hPa; (b) 500 hPa; 为了便于同其他指数进行比较, 相关系数乘了−1
Fig. 9 The correlation coefficient of Asian precipitation in winter with regionally mean geopotential height index of IBTs
at 700 hPa (a) and 500 hPa (b). The indices of IBTs were multiplying with −1 to compare with other indices